
Fig. 2
- ID
- ZDB-IMAGE-230224-2
- Publication
- Balamurugan et al., 2022 - PHLPP1 promotes neutral lipid accumulation through AMPK/ChREBP-dependent lipid uptake and fatty acid synthesis pathways
- All Figures
- Figures for Balamurugan et al., 2022
|
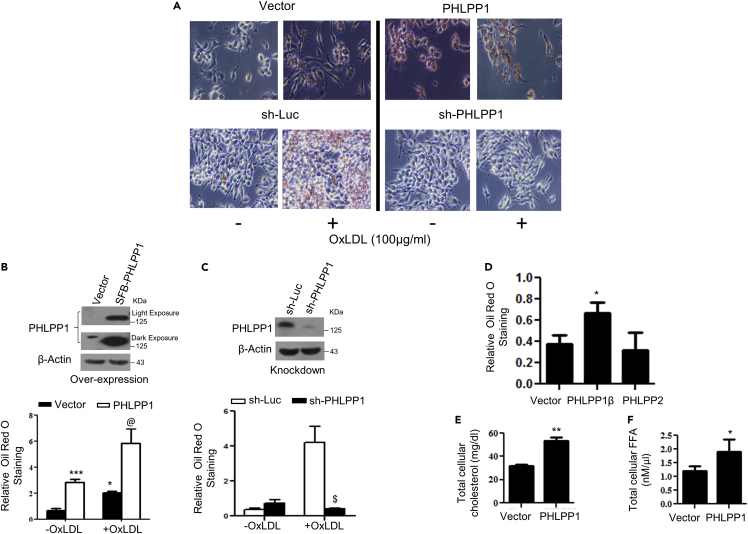
Fig. 2
PHLPP1 promotes foam cells in vitro
(A–C) Neutral lipid staining by Oil Red O (A) along with quantification in PHLPP1 overexpressing (A and B) or knockdown RAW 264.7 cells (A and C) with parallel immunoblot analysis (B and C top panels); Images are taken at |×20×| magnification. Each image in (A) is a representative image of four different experiments with a minimum of eight different fields in each experiment. Statistical analysis was performed using one-way ANOVA followed by Bonferroni′s post hoc test (∗p < 0.05, ∗∗∗p < 0.001 vs Vector-OxLDL; @p < 0.05 vs PHLPP1-OxLDL; $p < 0.05 vs sh-Luc+OxLDL).
(D) Neutral lipid staining in cells overexpressing PHLPP isoforms; Statistical analysis was performed using one-way ANOVA followed by Dunnett′s multiple comparisons test (∗p < 0.05 vs Vector).
(E and F) Total cellular cholesterol (E) and FFA levels (F) in RAW 264.7 cells upon PHLPP1 overexpression; Statistical analysis was performed using two-tailed t-test (∗p < 0.05, ∗∗p < 0.01 vs Vector). Data are a representative of at least three independent experiments. Numerical data are expressed as mean ± SEM.