
- Title
-
Accumulation of acetaldehyde in aldh2.1-/- zebrafish causes increased retinal angiogenesis and impaired glucose metabolism
- Authors
- Wohlfart, D.P., Lou, B., Middel, C.S., Morgenstern, J., Fleming, T., Sticht, C., Hausser, I., Hell, R., Hammes, H.P., Szendrödi, J., Nawroth, P.P., Kroll, J.
- Source
- Full text @ Redox Biol.
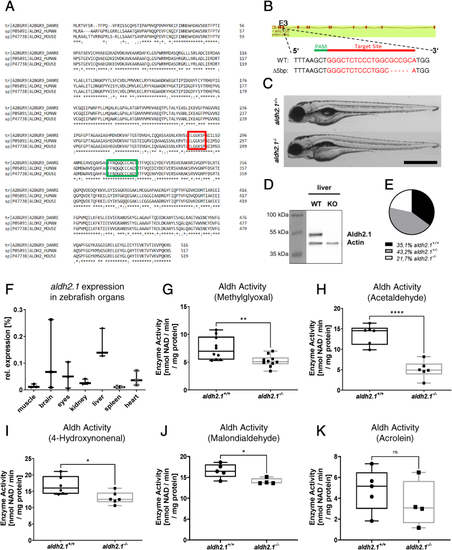
Generation and validation of an aldh2.1−/−zebrafish line. A: Amino acid alignment of Aldh2 across different species displays a high similarity between zebrafish (first line), human (second line) and mouse (third line); glutamic acid active site (red) and cysteine active site (green) are indicated. B: aldh2.1-CRISPR-target site was designed for exon 3 and CRISPR/Cas9 induced five nucleotides base pair deletion was selected for further studies. C: Images of aldh2.1+/+ and aldh2.1−/− larvae showed no difference at 5 dpf. Black scale bar: 500 μm. D: Western blot for Aldh2.1 and Actin proteins in adult liver confirmed the loss of Aldh2.1 in aldh2.1−/− mutants. E: Adult aldh2.1+/− and aldh2.1−/− animals are underrepresented according to the Mendelian distribution. aldh2.1+/+ = 99 (35.1%), aldh2.1+/− = 122 (43.2%) and aldh2.1−/− = 61 (21.7%). F: aldh2.1 mRNA expression in aldh2.1+/+ zebrafish was highest in liver (15%) followed by brain (6.8%) and eyes (5%). Expression was quantified via RT-qPCR and normalized to b2m, n = 3, one organ per sample. G-K: aldh2.1−/− mutants displayed decreased Aldh enzyme activity with MG (G) as substrate, n = 10; AA (H) as substrate, n = 6; 4-HNE (I) as substrate, n = 6 and MDA (J) as substrate, n = 4–5, but unaltered Aldh enzyme activity with ACR (K) as substrate, n = 4–5. Enzyme activity was quantified via spectrophotometry of NAD metabolic rate (nmol NAD \ min \ mg protein) in zebrafish lysates at 96 hpf, 50 larvae per clutch. Statistical analysis was done via Student's t-test, ns = not significant, *p < 0.05, **p < 0.01, ***p < 0.001, ****p < 0.0001. (For interpretation of the references to colour in this figure legend, the reader is referred to the Web version of this article.) |
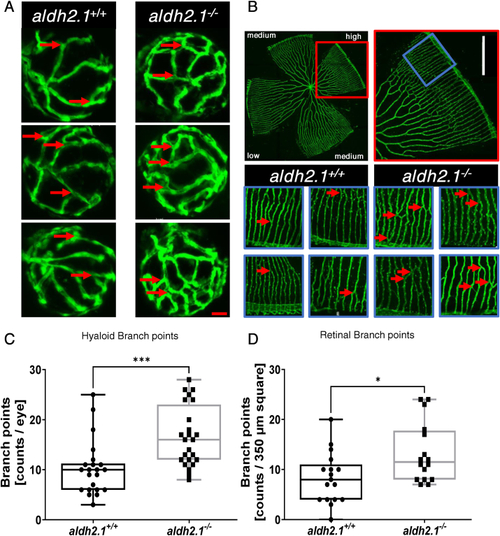
Loss of aldh2.1 led to increased angiogenesis in the retinal vasculature of zebrafish larvae and adults. A: Representative confocal images of hyaloid vasculature in zebrafish larvae at 120 hpf displayed increased branching. Red scale bar: 20 μm, red arrows: branch points as counted for quantification. B: Representative confocal images of adult zebrafish retinae showed increased angiogenesis. White Scale Bar: 350 μm, red rectangle: high-density subdivision, blue rectangle 350 μm square, red arrows: branch points as counted for quantification. C: Quantification of larval hyaloid vasculature showed increased numbers of branch points in aldh2.1−/− mutants, n = 22–24 eyes per group. D: Quantification of retinal vasculature showed increased numbers of branch points in aldh2.1−/− adults, n = 16–17 350 μm squares per group, statistical analysis was done via Student's - test, *p < 0.05, ***p < 0.001. (For interpretation of the references to colour in this figure legend, the reader is referred to the Web version of this article.) |
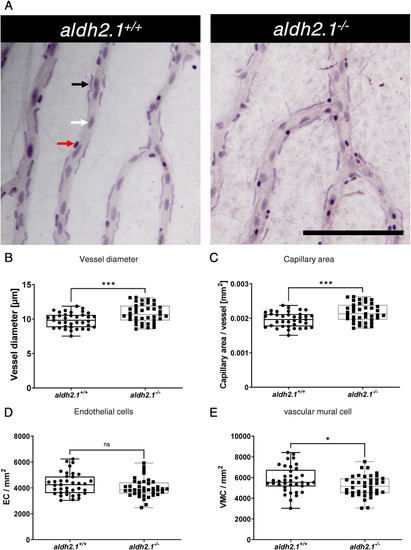
Thickening of blood vessels and reduction of vascular mural cell coverage in aldh2.1−/−retinae. A: Representative light microscopy images of zebrafish retinae prepared with trypsin digestion and hematoxylin staining. Red Arrow: erythrocyte, black arrow: pericyte, white arrow: endothelial cell, black scale bar: 100 μm. B-E: Quantification of vascular parameters. B: Increased vessel diameter, C: Increased capillary area, D: Unaltered endothelial cell count and E: Reduced vascular mural cell count. n = 37–39. Statistical analysis was done via Student's t-test, ns = not significant, *p < 0.05, ***p < 0.001. (For interpretation of the references to colour in this figure legend, the reader is referred to the Web version of this article.) |
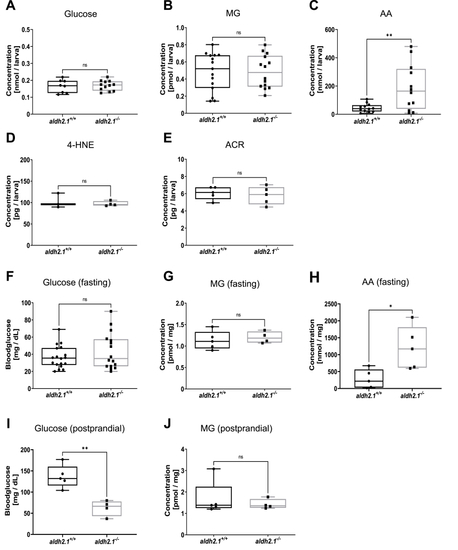
aldh2.1−/−mutants displayed an elevation of endogenous AA and lowered postprandial blood glucose. A–E: Determination of glucose and endogenous reactive metabolites in 96 hpf old zebrafish larvae displayed significantly increased AA (C) in aldh2.1−/− mutants, but no changes for glucose (A), MG (B), 4-HNE (D) or ACR (E), n = 3–15 clutches, 50 larvae per clutch. Measurements were done via ELISA (A,D,E) or GC-MS/LC-MSMS (B,C). F-J: Glucose and endogenous reactive metabolites in adult zebrafish displayed significantly increased AA (H) in aldh2.1−/− liver and decreased postprandial blood glucose (I). MG (G,J) in fasted and postprandial zebrafish eyes as well as fasting blood glucose (F) stayed unaltered in aldh2.1−/− zebrafish, n = 4–18. Measurement of blood glucose was perfomed with a glucometer. MG and AA were measured via GC-MS and LC-MSMS respectively. Statistical analysis was done via Student's t-test, ns = not significant, *p < 0.05, **p < 0.01. |

aldh2.1−/−mutants exhibited aggravated stress-signaling and an impairment of glycolysis and gluconeogenesis. A: Bar diagram for highest, significantly increased or decreased pathways in a Kyoto-encyclopedia of gene and genomes (KEGG) pathways analysis in aldh2.1−/− larvae. B-E: Gene set enrichment analysis (GSEA) plots for VEGF (B), MAPK (C), glycolysis/gluconeogenesis (D), pyruvate metabolism (E) pathways. RNA-seq was done with mRNA in 120 hpf zebrafish larvae, quantification via normalized enrichment score (NES), n = 5 clutches, 50 larvae per clutch, ns = not significant, *p < 0.05, **p < 0.01, ***p < 0.001. |
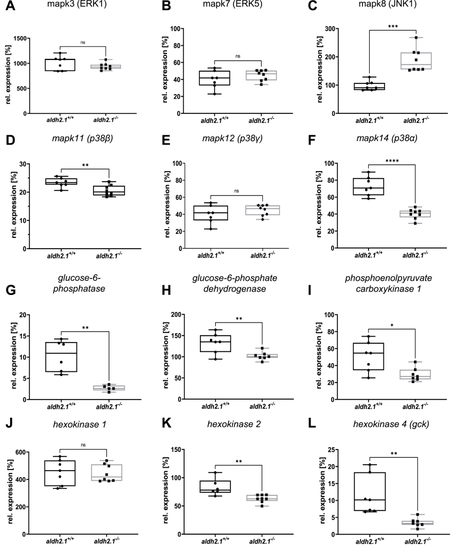
Inhibition of glucose-6-phosphatase/glucokinase expression and alteration of JNK and p38 MAPK expression in aldh2.1−/−mutants. A-F: Expression of MAPK family members. ERK1 (A), ERK5 (B) and p38γ (E) were unaltered in aldh2.1−/− larvae. JNK1 (C) is significantly upregulated; p38α (F) and p38β (D) were significantly downregulated in aldh2.1−/− animals. G-L: Expression of key regulatory genes of glycolysis and gluconeogenesis. Strongest down regulation in aldh2.1−/− larvae is shown for g6pc (G) and gck (L). g6pd (H), pck1 (I) and hk2 (K) were also significantly down regulated. hk1 (J) gene expression was unchanged. Expression was quantified via RT-qPCR with 96 hpf zebrafish larvae and normalized to arnt2, n = 5–8 clutches, 50 larvae per clutch. Statistical analysis was done via Student's t-test, ns = not significant, *p < 0.05, **p < 0.01, ***p < 0.001, ****p < 0.0001. |
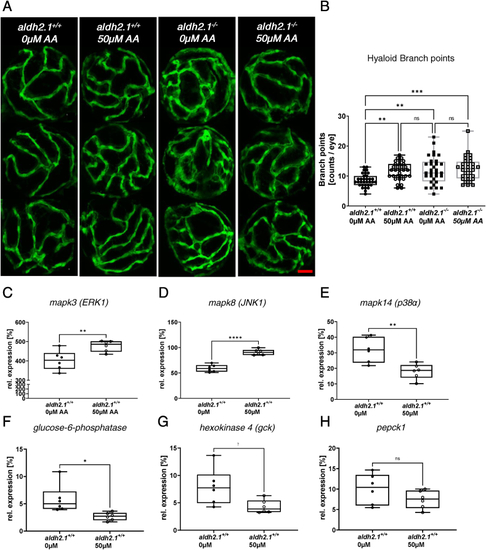
Exogenous AA caused angiogenic alterations in hyaloid vasculature, impairment of glucose metabolism and alteration of MAPK signaling. A: Representative confocal images of hyaloid vasculature in zebrafish larvae at 120 hpf with and without AA treatment. Red scale bar: 20 μm. B: Quantification of larval hyaloid vasculature showed increased numbers of branch points in aldh2.1+/+ larvae after AA (50 μm) treatment, which was not further enhanced in aldh2.1−/− larvae, n = 32–33 eyes per group. C-E: Expression of MAPK family members. ERK1 gene expression (C) was increased in aldh2.1+/+ larvae after AA treatment. Additionally, aldh2.1+/+ larvae with 50 μm AA treatment exhibited increased JNK1 expression (D) and decreased p38α expression (E). F–H: Expression of selected genes of glycolysis and gluconeogenesis. Reduced expression of g6pc (F) and gck (G) after AA treatment. pepck gene expression (H) was also reduced, although not significantly. Expression was quantified via RT-qPCR with 96 hpf zebrafish larvae and normalized to arnt2, n = 6 clutches, 50 larvae per clutch. Statistical analysis was done via Student's t-test, ns = not significant, *p < 0.05, **p < 0.01, ***p < 0.001, ****p < 0.0001. (For interpretation of the references to colour in this figure legend, the reader is referred to the Web version of this article.) |

Inhibition of p38 MAPK caused angiogenic alterations in hyaloid vasculature in aldh2.1+/+larvae. A) Representative confocal images of hyaloid vasculature in zebrafish larvae at 120 hpf with and without MAPK inhibitor treatment. Red scale bar: 20 μm. B) Quantification of larval hyaloid vasculature showed increased amount of branch points in aldh2.1+/+ larvae with MAPK inhibitor comparable to aldh2.1−/− mutants, n = 23–28 eyes per group. Statistical analysis was done via Student's t-test, ns = not significant, *p < 0.05. (For interpretation of the references to colour in this figure legend, the reader is referred to the Web version of this article.) |