
|
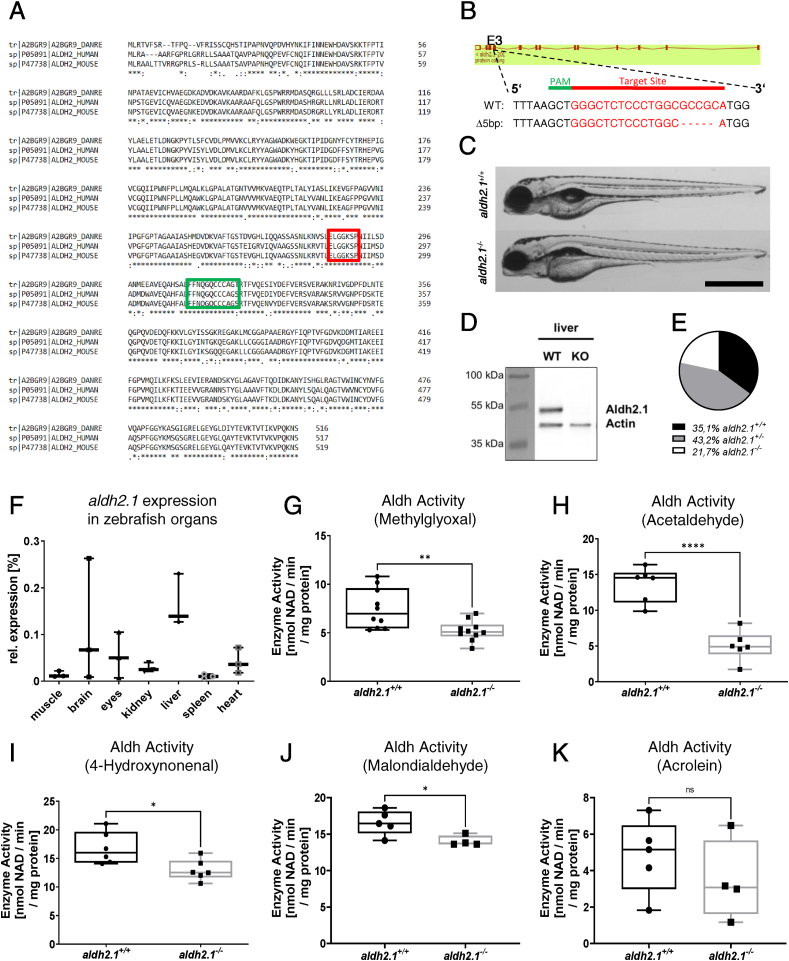
Fig. 1
Generation and validation of an aldh2.1−/−zebrafish line. A: Amino acid alignment of Aldh2 across different species displays a high similarity between zebrafish (first line), human (second line) and mouse (third line); glutamic acid active site (red) and cysteine active site (green) are indicated. B: aldh2.1-CRISPR-target site was designed for exon 3 and CRISPR/Cas9 induced five nucleotides base pair deletion was selected for further studies. C: Images of aldh2.1+/+ and aldh2.1−/− larvae showed no difference at 5 dpf. Black scale bar: 500 μm. D: Western blot for Aldh2.1 and Actin proteins in adult liver confirmed the loss of Aldh2.1 in aldh2.1−/− mutants. E: Adult aldh2.1+/− and aldh2.1−/− animals are underrepresented according to the Mendelian distribution. aldh2.1+/+ = 99 (35.1%), aldh2.1+/− = 122 (43.2%) and aldh2.1−/− = 61 (21.7%). F: aldh2.1 mRNA expression in aldh2.1+/+ zebrafish was highest in liver (15%) followed by brain (6.8%) and eyes (5%). Expression was quantified via RT-qPCR and normalized to b2m, n = 3, one organ per sample. G-K: aldh2.1−/− mutants displayed decreased Aldh enzyme activity with MG (G) as substrate, n = 10; AA (H) as substrate, n = 6; 4-HNE (I) as substrate, n = 6 and MDA (J) as substrate, n = 4–5, but unaltered Aldh enzyme activity with ACR (K) as substrate, n = 4–5. Enzyme activity was quantified via spectrophotometry of NAD metabolic rate (nmol NAD \ min \ mg protein) in zebrafish lysates at 96 hpf, 50 larvae per clutch. Statistical analysis was done via Student's t-test, ns = not significant, *p < 0.05, **p < 0.01, ***p < 0.001, ****p < 0.0001. (For interpretation of the references to colour in this figure legend, the reader is referred to the Web version of this article.)