
- Title
-
Single-cell transcriptomic analysis of zebrafish cranial neural crest reveals spatiotemporal regulation of lineage decisions during development
- Authors
- Tatarakis, D., Cang, Z., Wu, X., Sharma, P.P., Karikomi, M., MacLean, A.L., Nie, Q., Schilling, T.F.
- Source
- Full text @ Cell Rep.
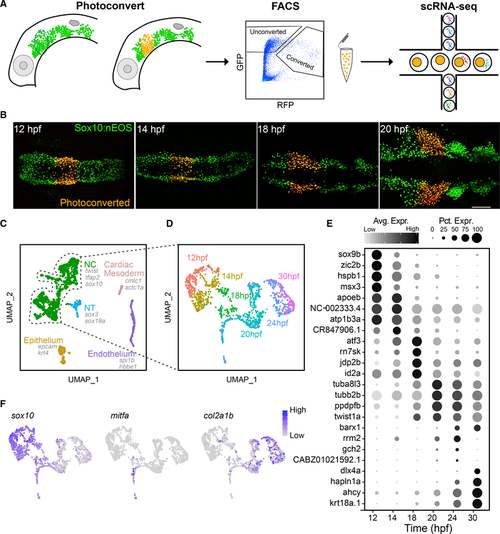
Time course scRNA-seq of isolated first pharyngeal arch (PA1) neural crest (NC) cells
(A) Diagram showing experimental design. Lateral views of the head of a sox10:nEOS transgenic, showing migrating NC cells expressing photoconvertible nEOS (green) that were photoconverted (red) and isolated via FACS and then sequenced using 10X Genomics Drop-seq. (B) Live fluorescent images, dorsal views, anterior to the left, showing photoconverted NC cells in the PA1 migratory stream at 4 of 6 time points. (C) Unbiased clustering and UMAP embedding showing NC and other cell types isolated. All 6 time points were aggregated and analyzed together. Canonical markers for each cell type are displayed. (D) The NC subpopulation from (C) was subclustered and reanalyzed. The UMAP displays time point identities for each cell. (E) Dot plot displaying markers for each time point and their relative levels of expression. Size of dots represents percentage of cells expressing the gene. Gray scale intensity represents relative average expression among cells. (F) UMAPs displaying relative expression levels for presumptive early NC, pigment, and cartilage lineages marked by sox10, mitfa, and col2a1b, respectively. For micrographs, scale bar represents 100 mm. Each time point represents 1 library made up of 6–8 embryos. |

Temporal analysis of transcription factors in the NC
(A) NC dataset from Figure 1D re-analyzed using only TFs. The new UMAP shows the same broad structure but smoothens connections between time points (black lines). (B) The same UMAP overlayed with pseudotime values calculated using Monocle3. (C) Six modules of TFs identified with distinct expression profiles across pseudotime. Feature plots showing expression scores for each module overlayed with the UMAP. Three modules correspond to early NC, skeletal, and pigment branches, labeled as modules 1, 4, and 6, respectively (dashed line boxes), totaling 91 TFs. (D) Heatmap showing correlation between TFs making up early NC, skeletal, and pigment modules. Hierarchical clustering reveals groups of co-expressed TFs. Selected representative genes are labeled along the side. |

Pseudotemporal analysis reveals emergence of NC lineages during migration
(A) ForceAtlas (FA) embedding of single-cell timeline initialized using PAGA graph with time point identities of individual cells labeled and color coded. (B) Module scores, color code distinct from (A), for early NC, pigment, skeletal, and neural and glial lineages overlaid on FA embedding. (C) CellAssign probabilistic cell type labels computed using module score genes overlaid on FA embedding. Color code is distinct from (A) or (B). (D) Pseudotime calculated using PAGA graph. Cells are arranged according to pseudotime values along the x axis, with pseudotime scaled within each branch. Branch points are split on the y axis and connected by dashed lines. Color code corresponds to (C). (E) Scatterplots showing the increased specificity of marker genes to lineages across developmental time. Each point represents a gene contributing to a lineage score (color code from C) with the axes showing its Pearson correlation to the total score for pigment, skeletal, or neural and glial across all cells in each time point. |
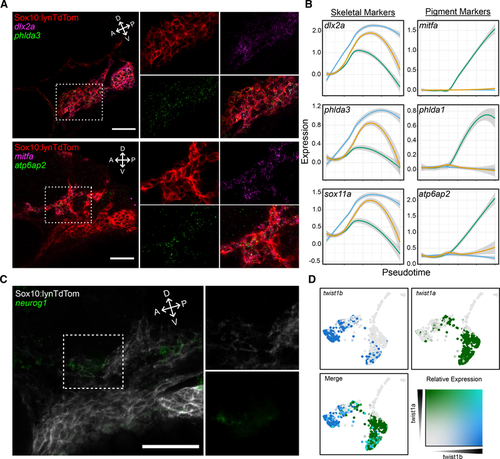
In situ hybridization chain reaction (isHCR) for markers identifies emerging NC lineages in vivo
(A) Confocal micrographs of isHCR for markers of skeletal and pigment progenitors in PA1 at 24 hpf in tg(sox10:lynTdTomato) embryos where NC plasma membranes are marked by tdTomato (red). Expression of phlda3 (green in upper panels) overlaps with dlx2a (magenta) in the ventral portion of the migratory stream, and atp6ap2 expression (green in lower panels) overlaps with mitfa (magenta) in the dorsal portion. (B) Local regression graphs for markers of early NC, pigment, and skeletal progenitors (color code corresponds to Figures 3C and and3D),3D), showing expression levels (y axis) across pseudotime (x axis). Lines indicate moving averages for each branch. Temporal expression profiles for phlda3 and sox11a strongly resemble that of dlx2a, while profiles of phlda1 and atp6ap2 resemble that of mitfa. (C) Confocal micrograph of isHCR for neurog1 (green), which marks neural progenitors in PA1 at 24 hpf, in tg(sox10:lynTdTomato) embryos where NC plasma membranes are marked by tdTomato (gray). (D) Feature plots showing expression of twist1b and twist1a. First two panels show individual expression patterns (blue and green, respectively). Third panel shows overlapping expression in teal. For micrographs, scale bars represent 50 μm. |
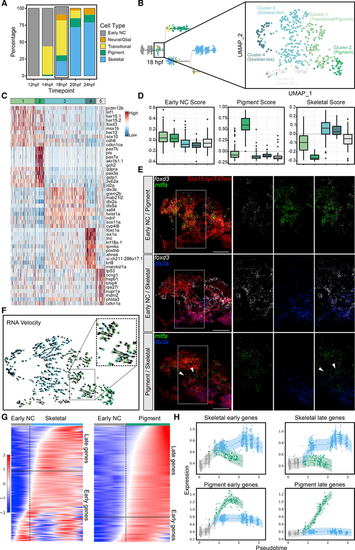
Analysis of 18 hpf scRNA-seq dataset shows emergence of distinct NC lineages as well as transitional cell states
(A) Stacked barplot showing percentages of cell types at each time point from 12 to 24 hpf. Color code corresponds to Figure 2C. (B) New larger scRNA-seq dataset generated at 18 hpf. Dimensionality reduction and unbiased clustering revealed 5 distinct clusters: 2 skeletal-like clusters; a pigment cluster; a transitional cluster; and a cluster showing signs of cell stress. Color code distinct from (A). (C) Heatmap showing top 10 marker genes for each cluster; colored bar across the top indicates color code corresponding to (B). (D) Boxplots showing early NC, pigment, and skeletal module scores for each cluster. Color coding corresponds to (B) and (C). (E) Confocal micrographs of isHCR for known markers of early NC (foxd3, white), pigment (mitfa, green), and skeletal (dlx2a, blue) progenitors in tg(sox10:-lynTdTomato) embryos where NC plasma membranes are marked by tdTomato (red). Expression of foxd3 overlaps strongly with mitfa and to a lesser extent with dlx2a. Although mitfa and dlx2a mostly do not overlap, a few cells do have overlapping expression (indicated by white arrows). (F) RNA velocity showing differentiation trajectories (arrows) for all cells. The transitional population (inset) is split between progressing toward the skeletal (blue) and pigment (green) clusters. (G) Heatmaps for pigment and skeletal branches with cells ordered by pseudotime. One set of genes marks the transition from early NC to skeletal, and another marks the transition from early NC to pigment. Delineation between early and late genes along these trajectories is marked by horizontal black lines. (H) Local regression graphs showing expression scores for early and late pigment and skeletal markers with cells ordered by pseudotime. A clear branch point marks emergence of pigment (green) and skeletal (blue) lineages. For micrographs, scale bars represent 50 μm. |

Bulk RNA-seq of a transgenic Wnt reporter combined with scRNA-seq analysis reveals temporal kinetics of Wnt signaling
(A) Diagram showing experimental design. Lateral views of the head of a sox10:EGFP;7xTCF:nls-mCherry transgenic show migrating NC cells with either high (high Wnt) or low (low Wnt) mCherry levels were isolated via FACS at 24 hpf and then combined for bulk RNA sequencing. Differentially expressed (DE) genes were then analyzed using our scRNA-seq timeline to uncover temporal patterns. (B) Heatmap showing DE genes between high-Wnt and low-Wnt cells. (C) Wnt-upregulated genes were clustered based on their temporal profiles in the scRNA-seq timeline using DPGP (Dirichlet Process Gaussian Process). The timeline (x axis) was split into pigment (right panels) and non-pigment (left panels) branches to separate out Wnt-regulated genes that specifically drive pigment specification. For each branch, two major clusters of genes have either early (lower panels) or late (upper panels) expression signatures. Two genes with these profiles from each temporal cluster are indicated as examples within the plots. |
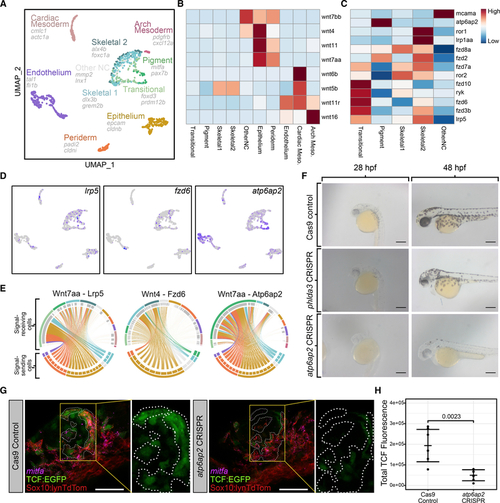
Emergence of pigment and skeletal lineages in NC cells coincides with Wnt signals from epithelial tissues
(A) UMAP showing all cell types isolated from photoconverted PA1 NC cells. Cell types determined from top DE genes and combined with NC subtype identities from our NC-specific analysis. (B) Heatmap showing average expression of Wnt ligands in each cell type. (C) Heatmap showing average expression of Wnt receptors in each cell type. (D) Feature plots showing expression of Wnt receptors lrp5, fzd6, and atp6ap2. (E) Circos plots showing imputed signaling interactions. Top segments of each circle indicate signal-receiving cells. Bottom segments indicate signal-sending cells. Each line indicates a signaling event between two individual cells. Lines are colored according to the cell type identity of the signal-sending cell. Colors are consistent with UMAP. (F) Live embryos injected with either Cas9 alone (top row) or Cas9 and 4 gRNAs targeting phlda3 (middle row) or atp6ap2 (bottom row) shown in lateral views at 28 hpf (left column) and 48 hpf (right column). Note reduced black melanocyte pigmentation with atp6ap2 CRISPR. (G) Confocal micrographs showing Wnt-responsive TCF-EGFP (green, outlined by dashed white lines) and mitfa (magenta) expression in PA1 at 24 hpf in tg(sox10:lynTdTomato;7xTCF:EGFP) embryos where NC plasma membranes are marked by tdTomato (red). (H) Quantification of 7xTCF:EGFP using corrected total fluorescence intensity between control embryos (n = 7 embryos; mean = 193,407) and atp6ap2 CRISPR embryos (n = 6 embryos; mean = 49,567). Wilcoxon rank-sum test p = 0.0023. Dots represent mean in individual embryos. Lines represent mean within conditions. Error bars represent mean ± SD. For micrographs, scale bars represent 50 μm. |