
Figure 1.
- ID
- ZDB-FIG-220131-126
- Publication
- Tatarakis et al., 2021 - Single-cell transcriptomic analysis of zebrafish cranial neural crest reveals spatiotemporal regulation of lineage decisions during development
- Other Figures
- All Figure Page
- Back to All Figure Page
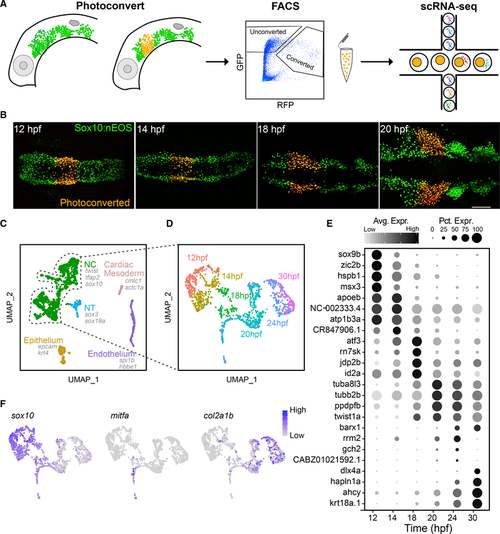
Time course scRNA-seq of isolated first pharyngeal arch (PA1) neural crest (NC) cells
(A) Diagram showing experimental design. Lateral views of the head of a sox10:nEOS transgenic, showing migrating NC cells expressing photoconvertible nEOS (green) that were photoconverted (red) and isolated via FACS and then sequenced using 10X Genomics Drop-seq. (B) Live fluorescent images, dorsal views, anterior to the left, showing photoconverted NC cells in the PA1 migratory stream at 4 of 6 time points. (C) Unbiased clustering and UMAP embedding showing NC and other cell types isolated. All 6 time points were aggregated and analyzed together. Canonical markers for each cell type are displayed. (D) The NC subpopulation from (C) was subclustered and reanalyzed. The UMAP displays time point identities for each cell. (E) Dot plot displaying markers for each time point and their relative levels of expression. Size of dots represents percentage of cells expressing the gene. Gray scale intensity represents relative average expression among cells. (F) UMAPs displaying relative expression levels for presumptive early NC, pigment, and cartilage lineages marked by sox10, mitfa, and col2a1b, respectively. For micrographs, scale bar represents 100 mm. Each time point represents 1 library made up of 6–8 embryos. |