
Figure 4.
- ID
- ZDB-FIG-220131-138
- Publication
- Tatarakis et al., 2021 - Single-cell transcriptomic analysis of zebrafish cranial neural crest reveals spatiotemporal regulation of lineage decisions during development
- Other Figures
- All Figure Page
- Back to All Figure Page
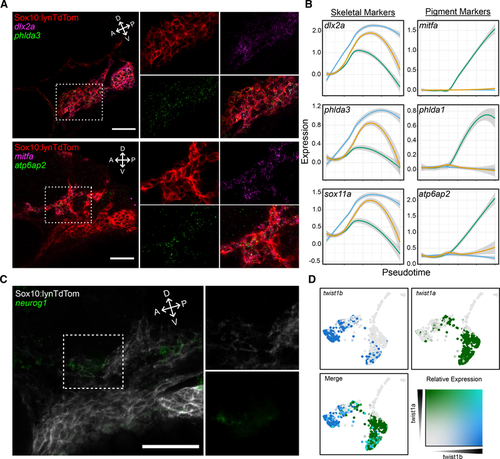
In situ hybridization chain reaction (isHCR) for markers identifies emerging NC lineages in vivo
(A) Confocal micrographs of isHCR for markers of skeletal and pigment progenitors in PA1 at 24 hpf in tg(sox10:lynTdTomato) embryos where NC plasma membranes are marked by tdTomato (red). Expression of phlda3 (green in upper panels) overlaps with dlx2a (magenta) in the ventral portion of the migratory stream, and atp6ap2 expression (green in lower panels) overlaps with mitfa (magenta) in the dorsal portion. (B) Local regression graphs for markers of early NC, pigment, and skeletal progenitors (color code corresponds to Figures 3C and and3D),3D), showing expression levels (y axis) across pseudotime (x axis). Lines indicate moving averages for each branch. Temporal expression profiles for phlda3 and sox11a strongly resemble that of dlx2a, while profiles of phlda1 and atp6ap2 resemble that of mitfa. (C) Confocal micrograph of isHCR for neurog1 (green), which marks neural progenitors in PA1 at 24 hpf, in tg(sox10:lynTdTomato) embryos where NC plasma membranes are marked by tdTomato (gray). (D) Feature plots showing expression of twist1b and twist1a. First two panels show individual expression patterns (blue and green, respectively). Third panel shows overlapping expression in teal. For micrographs, scale bars represent 50 μm. |