
- Title
-
Pro-Angiogenic Effects of Essential Oil from Perilla frutescens and Its Main Component (Perillaldehyde) on Zebrafish Embryos and Human Umbilical Vein Endothelial Cells
- Authors
- Zhou, F., Dai, O., Peng, C., Xiong, L., Ao, H., Liu, F., Zhou, Q.M.
- Source
- Full text @ Drug Des Devel Ther
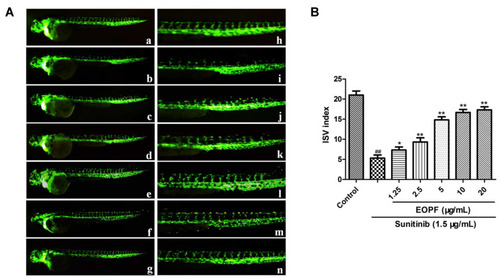
EOPF promoted angiogenesis of zebrafish. (A) Fluorescent images of blood vessels of zebrafish: a. control; b. treatment with 1.5 µg/mL sunitinib; c. treatment with 1.5 µg/mL sunitinib plus 1.25 µg/mL EOPF; d. treatment with 1.5 µg/mL sunitinib plus 2.5 µg/mL EOPF; e. treatment with 1.5 µg/mL sunitinib plus 5 µg/mL EOPF; f. treatment with 1.5 µg/mL sunitinib plus 10 µg/mL EOPF; g. treatment with 1.5 µg/mL sunitinib plus 20 µg/mL EOPF. The images of h–n are partial enlargements of images a–g. (B) EOPF promoted angiogenesis of sunitinib-injured zebrafish. ##P < 0.01 vs untreated control, **P < 0.01 vs sunitinib, *P < 0.05 vs sunitinib. |
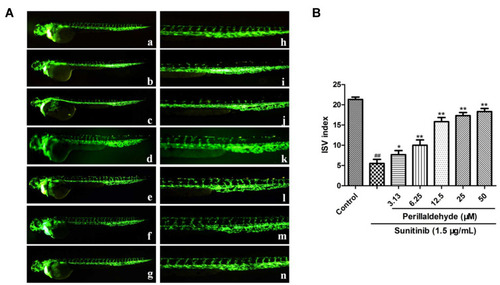
Perillaldehyde promoted angiogenesis of zebrafish. (A) Fluorescent images of blood vessels of zebrafish: a. control; b. treatment with 1.5 µg/mL sunitinib; c. treatment with 1.5 µg/mL sunitinib plus 3.13 µM perillaldehyde; d. treatment with 1.5 µg/mL sunitinib plus 6.25 µM perillaldehyde; e. treatment with 1.5 µg/mL sunitinib plus 12.5 µM perillaldehyde; f. treatment with 1.5 µg/mL sunitinib plus 25 µM perillaldehyde; g. treatment with 1.5 µg/mL sunitinib plus 50 µM perillaldehyde. The images of h–n were partial enlargements of images a–g. (B) Perillaldehyde promoted angiogenesis of sunitinib-injured zebrafish. ##P < 0.01 vs untreated control, **P < 0.01 vs sunitinib, *P < 0.05 vs sunitinib. |

EOPF promoted proliferation of HUVECs. (A) An MTT assay was carried out to measure HUVECs viability. EOPF at 2.5, 5, 10, and 20 µg/mL signally increased viability of sunitinib-treated HUVECs. (B) Cells of DAPI and EdU staining were captured. (C) EOPF at 5, 10, and 20 µg/mL observably promoted proliferation of sunitinib-injured HUVECs. Results are presented as the mean ± SD for three individual experiments. ##P < 0.01 vs untreated control, **P < 0.01 vs sunitinib. |
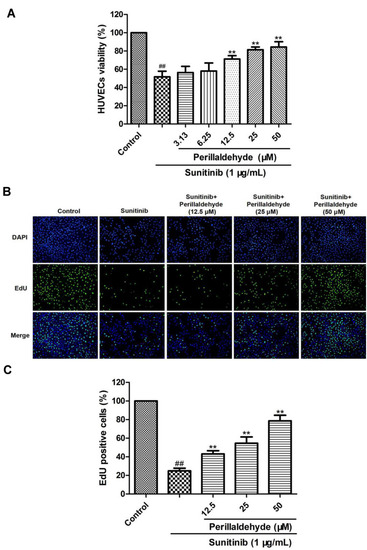
Perillaldehyde promoted proliferation of HUVECs. (A) An MTT assay was carried out to measure HUVECs viability. Perillaldehyde at 12.5, 25, and 50 µM signally increased viability of sunitinib-treated HUVECs. (B) Cells of DAPI and EdU staining were captured. (C) Perillaldehyde at 12.5, 25, and 50 µM observably promoted proliferation of sunitinib-injured HUVECs. Results are presented as the mean ± SD for three individual experiments. ##P < 0.01 vs untreated control, **P < 0.01 vs sunitinib. |
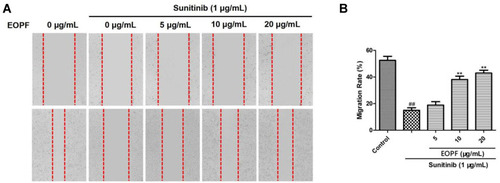
EOPF promoted migration of HUVECs. (A) The healing area of the wound at 0 and 24 h were photographed by a microscopy. (B) EOPF at 10 and 20 µg/mL dramatically boosted migration of HUVECs. Results are presented as the mean ± SD for three individual experiments. ##P < 0.01 vs untreated control, **P < 0.01 vs sunitinib. |
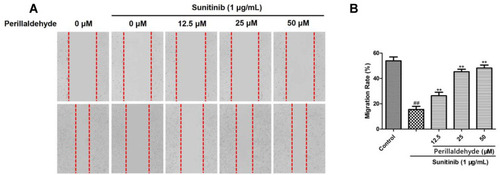
Perillaldehyde promoted migration of HUVECs. (A) The healing area of the wound at 0 and 24 h was photographed by a microscopy. (B) Perillaldehyde at 12.5, 25, and 50 µM prominently boosted migration of HUVECs. Results are presented as the mean ± SD for three individual experiments. ##P < 0.01 vs untreated control, **P < 0.01 vs sunitinib. |

EOPF promoted tube formation of HUVECs. (A) A microscope was used to photograph tubular structures (100 × magnification). (B) EOPF treatment at 5, 10, and 20 µg/mL significant boosted tube formation in sunitinib-injured HUVECs. Results are presented as the mean ± SD for three individual experiments. ##P < 0.01 vs untreated control, **P < 0.01 vs sunitinib, *P < 0.05 vs sunitinib. |
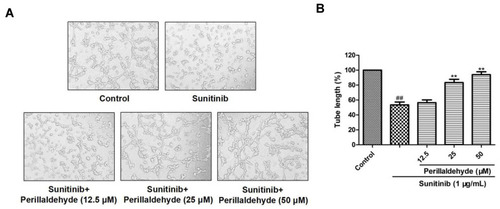
Perillaldehyde promoted tube formation of HUVECs. (A) A microscope was used to photograph tubular structures (100 × magnification). (B) Perillaldehyde treatment at 12.5, 25, and 50 µM dramatically boosted tube formation in sunitinib-injured HUVECs. Results are presented as the mean ± SD for three individual experiments. ##P < 0.01 vs untreated control, **P < 0.01 vs sunitinib. |
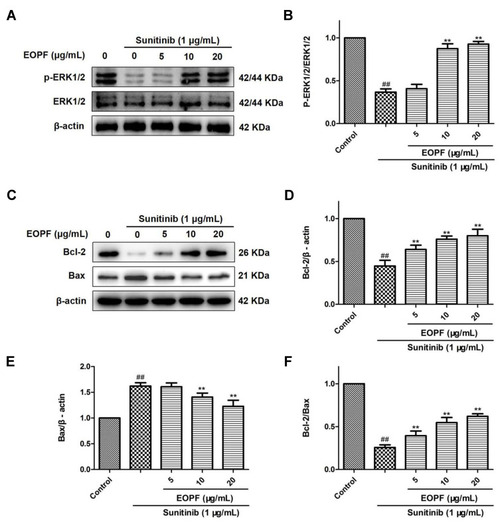
EOPF promoted angiogenesis by increasing p-ERK/ERK and Bcl-2/Bax expression ratios. (A) The protein levels of p-ERK (Thr202/Tyr204), ERK, and β-actin were examined by Western blot. (B) EOPF increased the ratio of p-ERK/ERK. (C) The protein levels of Bcl-2, Bax, and β-actin were measured via Western blot. (D) EOPF increased Bcl-2 expression levels. (E) EOPF decreased Bax expression levels. (F) EOPF increased the ratio of Bcl-2/Bax. Results are presented as the mean ± SD for three individual experiments. ##P < 0.01 vs untreated control, **P < 0.01 vs sunitinib. |
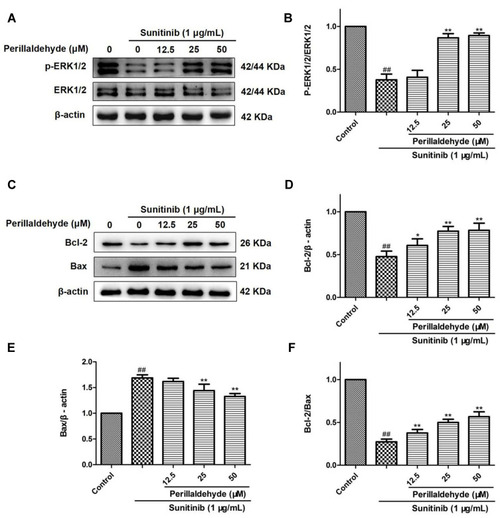
Perillaldehyde promoted angiogenesis by increasing p-ERK/ERK and Bcl-2/Bax expression ratios. (A) The protein levels of p-ERK (Thr202/Tyr204), ERK, and β-actin were examined by Western blot. (B) Perillaldehyde increased the expression ratio of p-ERK to ERK. (C) The protein levels of Bcl-2, Bax, and β-actin were measured via Western blot. (D) Perillaldehyde increased Bcl-2 expression levels. (E) EOPF decreased Bax expression levels. (F) Perillaldehyde increased the expression ratio of Bcl-2/Bax. Results are presented as the mean ± SD for three individual experiments. ##P < 0.01 vs untreated control, **P < 0.01 vs sunitinib, *P < 0.05 vs sunitinib. |