
|
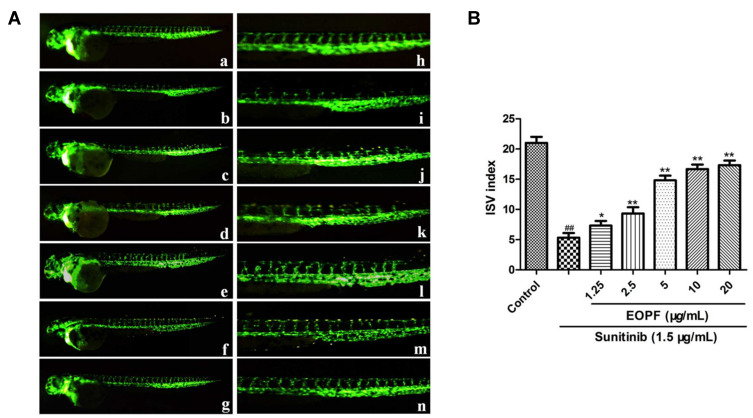
Fig. 1
EOPF promoted angiogenesis of zebrafish. (A) Fluorescent images of blood vessels of zebrafish: a. control; b. treatment with 1.5 µg/mL sunitinib; c. treatment with 1.5 µg/mL sunitinib plus 1.25 µg/mL EOPF; d. treatment with 1.5 µg/mL sunitinib plus 2.5 µg/mL EOPF; e. treatment with 1.5 µg/mL sunitinib plus 5 µg/mL EOPF; f. treatment with 1.5 µg/mL sunitinib plus 10 µg/mL EOPF; g. treatment with 1.5 µg/mL sunitinib plus 20 µg/mL EOPF. The images of h–n are partial enlargements of images a–g. (B) EOPF promoted angiogenesis of sunitinib-injured zebrafish. ##P < 0.01 vs untreated control, **P < 0.01 vs sunitinib, *P < 0.05 vs sunitinib.