
- Title
-
Rapid Directed Molecular Evolution of Fluorescent Proteins in Mammalian Cells
- Authors
- Babakhanova, S., Jung, E.E., Namikawa, K., Zhang, H., Wang, Y., Subach, O.M., Korzhenevskiy, D.A., Rakitina, T.V., Xiao, X., Wang, W., Shi, J., Drobizhev, M., Park, D., Eisenhard, L., Tang, H., Köster, R.W., Subach, F.V., Boyden, E.S., Piatkevich, K.D.
- Source
- Full text @ Protein Sci.
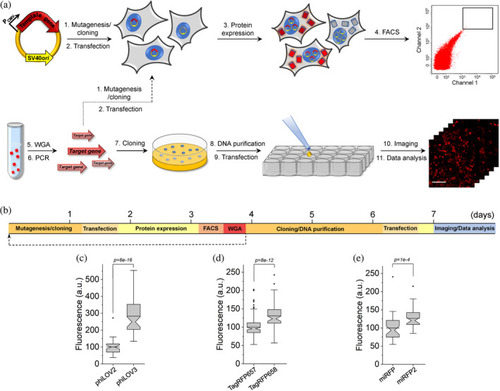
Rapid directed molecular evolution of fluorescent proteins in mammalian cells. (a) Workflow for directed evolution of proteins in HEK293FT cells using single-gene delivery via modified calcium phosphate transfection, fluorescence-activating cell sorting (FACS), and automated fluorescence imaging; WGA, whole-genome amplification. (b) Timeline of directed molecular evolution. (c) Green fluorescence of phiLOV2 and phiLOV3 expressed in HEK293FT cells (n = 40 and 59 cells, respectively, from two independent transfections for each protein; one-way analysis of variance [ANOVA] is used throughout this figure). Imaging conditions: excitation 475/34 nm from an LED, emission 527/50 nm. Box plots with notches are used throughout this paper, when n > 9 (the narrow part of notch, median; top and bottom of the notch, 95% confidence interval for the median; top and bottom horizontal lines, 25 and 75% percentiles for the data; whiskers extend 1.5× the interquartile range from the 25th and 75th percentiles; horizontal line, mean; dots represent outliers, data points which are less than the 25th percentile or greater than the 75th percentile by more than 1.5 times the interquartile range). (d) Near-infrared fluorescence of TagRFP657 and TagRFP658 expressed in HEK293FT cells (n = 181 and 76 cells, respectively, from two independent transfections for each protein). Imaging conditions: excitation 631/28 nm from an LED, emission 664LP. (e) Near-infrared fluorescence of miRFP and miRFP2 expressed in HEK293FT cells (n = 40 and 41 cells, respectively, from two independent transfections for each protein). Imaging conditions as in (d) |
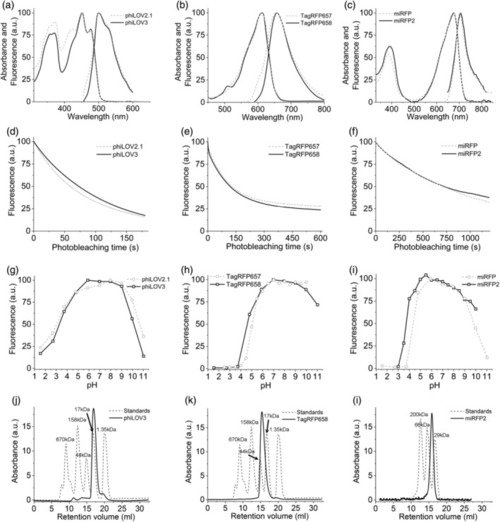
Spectroscopic and biochemical characterization of phiLOV3, TagRFP658, and miRFP2 in comparison to their precursors. (a–c) Absorption and fluorescence emission spectra of (a) phiLOV2.1 (dashed line) and phiLOV3 (solid line), (b) TagRFP657 (dashed line) and TagRFP658 (solid line), and (c) miRFP (dashed line) and miRFP2 (solid line). (d) Photobleaching curves of phiLOV2.1 (dashed line) and phiLOV3 (solid line) expressed in HEK293FT cells (n = 18 cells from 1 transfected sample, each). Photobleaching conditions: excitation 475/34 nm from an LED at ~5 mW/mm2. (e) Photobleaching curves of TagRFP657 (dashed line) and TagRFP658 (solid line) expressed in HEK293FT cells (n = 16 cells from 1 transfected sample, each). Photobleaching conditions: excitation 628/31BP from an LED at 95 mW/mm2. (f) Photobleaching curves of miRFP (dashed line) and miRFP2 (solid line) expressed in primary cultured mouse neurons (n = 25 and 61 cells, respectively, from one culture, each). Photobleaching conditions: excitation 628/31BP from an LED at 88 mW/mm2. (g–i) pH dependence of fluorescence for (g) phiLOV2.1 (dashed line) and phiLOV3 (solid line), (h) TagRFP657 (dashed line; data from Reference 32 ) and TagRFP658 (solid line), and (i) miRFP (dashed line; data from Reference 35) and miRFP2 (solid line). (j–l) Size-exclusion chromatography of (j) phiLOV3 at a concentration of 3.8 mg/ml, (k) TagRFP658 at a concentration of 8 mg/ml, and (l) miRFP2 at a concentration of 8.8 mg/ml (solid lines) and the indicated molecular weight standards (dashed lines) |
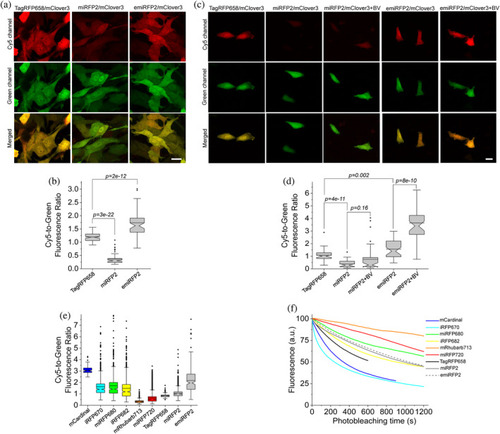
Fluorescence imaging of TagRFP658, miRFP2, and emiRFP2 expressed in mammalian and zebrafish cell cultures. (a) Representative fluorescence images of live NIH3T3 mouse embryonic fibroblasts co-expressing TagRFP658, miRFP2, and emiRFP2 with mClover3 under the EF1α:2xCMV:EF1α bidirectional promoter (n = 67, 62, and 59 cells, respectively, from one transfection each; the dynamic range of the images for the same channel was kept constant throughout the Panels (b) and (d)). Imaging conditions: Cy5 channel, excitation 633 nm from a laser, emission 660–785 nm; green channel, excitation 488 nm from a laser, emission 495–530 nm). (b) Cy5-to-green fluorescence ratio of live NIH3T3 fibroblasts shown in (a) (n = 67, 62, and 59 cells for TagRFP658, miRFP2, and emiRFP2, respectively, from one transfection each; Kruskal–Wallis analysis of variance [ANOVA]). Box plots with notches are used in this figure (see Figure 1c for the description). (c) Representative fluorescence images of live Pac2 zebrafish embryonic fibroblasts co-expressing TagRFP658, miRFP2, and emiRFP2 with mClover3 under the EF1α:2xCMV:EF1α bidirectional promoter with and without addition of 25 μM BV for 3 hr before imaging (n = 49, 36, 41, 39, and 39 cells for TagRFP658, miRFP2, miRFP2 + BV, emiRFP2, and emiRFP2 + BV, respectively, from one transfection each). Imaging conditions as in (a). (d) Cy5-to-green fluorescence ratio of live Pac2 fibroblasts shown in (c) with and without addition of 25 μM BV for 3 hr before imaging (n = 49, 36, 41, 39, and 39 cells for TagRFP658, miRFP2, miRFP2 + BV, emiRFP2, and emiRFP2 + BV, respectively, from one transfection each; Kruskal–Wallis ANOVA). Imaging conditions as in (a). Scale bars, 20 μm. (e) Cy5-to-green fluorescence ratio for near-infrared-fluorescent proteins (NIR-FPs) co-expressed with GFP via the P2A peptide in live HEK cells (n = 144; 775; 612; 837; 446; 2,937; 226; 1,981; and 271 cells for mCardinal, iRFP670, miRFP680, iRFP682, mRhubarb713, miRFP720, TagRFP658, miRFP2, and emiRFP2, respectively, from two independent transfections each). Box plots with notches are used in this figure (see Figure 1c for the full description). Imaging conditions: Cy5 fluorescence, excitation 635/22 nm from 637 nm laser, emission 730/140 nm; green fluorescence, excitation 478/24 nm for an LED; emission 535/46 nm. (f) Photobleaching curves for NIR-FPs expressed in live HEK cells under continuous wide-field illumination from 637 nm laser at 66 mW/mm2 (n = 55, 32, 10, 43, 32, 48, 56, 38, and 37 cells for mCardinal, iRFP670, miRFP680, iRFP682, mRhubarb713, miRFP720, TagRFP658, miRFP2, and emiRFP2, respectively, from two independent transfections each) |
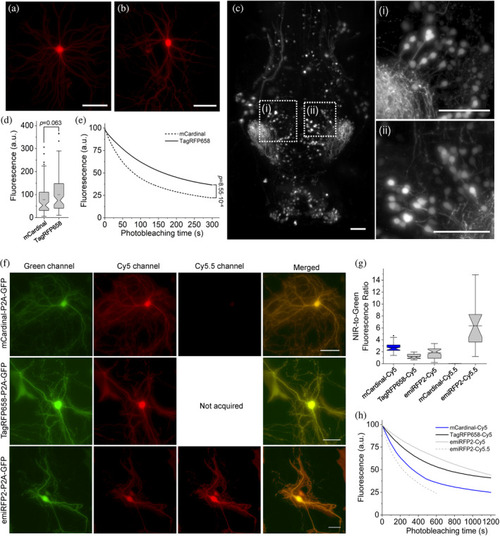
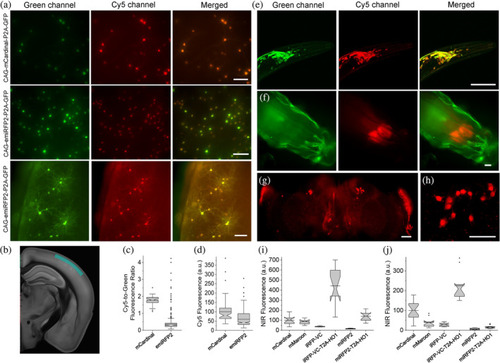
Intracellular brightness and photostability of mCardinal, TagRFP658, and emiRFP2 in live cultured hippocampal mouse neurons and in vivo in zebrafish larvae. (a,b) Representative fluorescence images of primary cultured mouse hippocampal neurons expressing TagRFP658 at (a) 14 and (b) 23 days in vitro (DIV; n = 53 and 33 neurons, respectively, from two independent cultures). Imaging condition: excitation 631/28 nm from an LED, emission 664LP. (c) Representative light sheet image of head of zebrafish larvae at 4 days postfertilization expressing TagRFP658 in neurons (n = 10 fish from two independent injections). Imaging conditions: excitation 638 nm from a laser, emission 665LP. (i, ii) High-magnification images of the respective regions shown in white boxes in e. Scale bars, 50 μm. (d) Relative fluorescence of cultured mouse hippocampal neurons expressing mCardinal and TagRFP658 (n = 78 and 85 neurons, respectively, from two independent cultures for each protein; one-way analysis of variance [ANOVA]). Imaging conditions as in (a). Box plots with notches are used in this figure (see Figure 1c for the full description). (e) Raw photobleaching curves for mCardinal (dashed line) and TagRFP658 (solid line) in primary cultured mouse hippocampal neurons (n = 9 and 7 neurons, respectively, from one culture each; one-way ANOVA). Imaging condition: excitation 631/28 nm from an LED at 70 mW/mm2, emission 664LP. (f) Representative fluorescence images of cells transfected with pAAV-CAG-mCardinal-P2A-GFP (top), pAAV-TagRFP658-P2A-GFP (middle), and pAAV-emiRFP2-P2A-GFP (n = 39, 33, and 41 neurons from three, two, and three independent transfections from one culture each for mCardinal, TagRFP658, and emiRFP2, respectively, for Cy5 channel and n = 15 and neurons from one independent transfection from one culture each for mCardinal and emiRFP2, respectively, for Cy5.5 channel). Imaging conditions: Cy5 channel: excitation 635/22 nm from 637 nm laser, emission 730/140 nm; Cy5.5 channel: excitation 680/13 nm from 680 nm laser, emission 710 LP; GFP channel: excitation 478/24 nm for an LED; emission 535/46 nm. Images in Cy5 and Cy5.5 were taken under matching excitation intensity (66 mW/mm2) and the same exposure time (100 ms). The dynamic range of fluorescence intensity in Cy5 and Cy5.5 channels are identical across all images. Scale bar, 20 μm. (g) Near-infrared (NIR)-to-green fluorescence ratio for mCardinal, TagRFP658, and emiRFP2 for the experiment shown in (f). (h) Intracellular photostability of mCardinal, TagRFP658, and emiRFP2 in Cy5 and Cy5.5 channels (n = 8, 7, and 9 neurons from three, two, and three independent transfections from one culture each for mCardinal, TagRFP658, and emiRFP2, respectively, under Cy5 excitation and n = 5 neurons from one transfection from one culture for emiRFP2 under Cy5.5 excitation). Imaging conditions the same as in (a) |
In vivo imaging and characterization of miRFP2 and emiRFP2. (a) Representative fluorescence images of live brain slices expressing mCardinal-P2A-GFP (top) and emiRFP2-P2A-GFP (middle and bottom; n = 6 slices from three mice each; L1 and L2/3 of somatosensory cortex, see Panel (b) for brain map). Imaging conditions: green channel: excitation 478/24 nm for an LED, emission 535/46 nm; Cy5 channel: excitation 635/22 nm from 637 nm laser, emission 730/140 nm. Top and middle rows of images are presented using the same dynamic range to facilitate visual comparison of mCardinal and emiRFP2 expressing neurons, bottom row images have adjusted LUTs to visualize processes of the emiRFP2 positive neurons. Scale bars, 100 μm. (b) Brain section indicating imaged region highlighted in marine blue (image from kimlab.io/brain-map). (c) Cy5-to-green fluorescence ratio of live neurons shown in (a) (n = 67 and 803 neurons from three mice each for mCardinal and emiRFP2, respectively). Imaging conditions same as in (a). (d) Cy5 mean fluorescence of live neurons shown in (a) (n = 67 and 803 neurons from three mice each for mCardinal and emiRFP2, respectively). Imaging conditions same as in (a). (e) Representative fluorescence images of the Caenorhabditis elegans head co-expressing codon-optimized genes of miRFP2-T2A-HO1 and jGCaMP7b in neurons (n = 15 worms from two independent microinjections). Imaging conditions: green channel, excitation 488 nm from a laser, emission 500–650 nm; Cy5 channel, excitation 631 nm from a laser, emission 645–700 nm. Scale bar, 50 μm. (f) Representative fluorescence images of live intact third instar Drosophila larva expressing miRFP2-T2A-HO1 (n = 10 larvae from two transgenic lines). Imaging conditions: green channel, excitation 475/34 nm from LED, emission 527/50 nm (green fluorescence corresponds to autofluorescence); Cy5 channel, excitation 631/28 nm from LED, emission 665LP. Scale bar, 100 μm. (g) Representative low-magnification fluorescence image of brain explant from adult Drosophila fly expressing codon-optimized gene of miRFP2-T2A-HO1 in R84C10-GAL4 line (n = 5 brains from one transgenic lines). Imaging conditions: excitation 635/22 nm from 637 nm laser, emission 665LP. Scale bar, 50 μm. (h) Representative high-magnification fluorescence image of brain explant from adult Drosophila fly expressing codon-optimized miRFP2-T2A-HO1 in R84C10-GAL4 line (n = 5 brains from one transgenic lines). Imaging conditions: excitation 631 nm from a laser, emission 645–700 nm. Scale bar, 50 μm. (i) Relative near-infrared (NIR) fluorescence of mCardinal, mMaroon, iRFP-VC, iRFP-VC-T2A-HO1, miRFP2, and miRFP2-T2A-HO1 expressed pan-neuronally in Drosophila third instar larvae (n = 10, 12, 7, 11, 9, and 10 larvae from one transgenic line each, respectively). Imaging conditions same as in (h). (j) Relative Cy5 fluorescence of mCardinal, mMaroon, iRFP-VC, iRFP-VC-T2A-HO1, miRFP2, and miRFP2-T2A-HO1 expressed pan-neuronally in adult Drosophila fly (n = 19, 10, 11, 11, 11, and 21 flies from one transgenic line each, respectively). Imaging conditions same as in (h) |
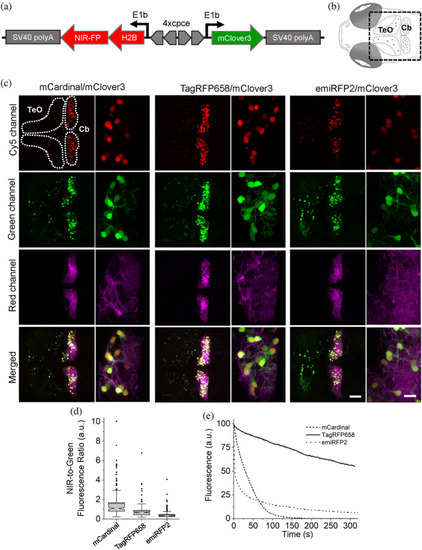
Three-color in vivo imaging of zebrafish larvae. (a) Schematic drawing of a bidirectional PC-specific expression system using 4x PC specific regulatory element (cpce) to co-express near-infrared (NIR)-FP-H2B fusion protein with mClover3. (b) Schematic drawings of dorsal view of 4 days postfertilization (dpf) larval zebrafish brain region delineating the optic tectum (TeO) and the cerebellum (Cb). The region of interest enclosed by a square was recorded in images shown below. (c) Representative confocal images of 4 dpf zebrafish larvae transiently co-expressing H2B-NIR-FP with mClover3 (expression of this construct occurs in a mosaic manner) in stable transgenic background with PC specific membrane targeted mScarlet. The TeO and the cerebellar region (Cb) are enclosed by the white dashed lines. Each subset of images (left, whole overview of tecum and cerebellar region; right, higher magnified images depicting PCs) shows the expression of each H2B-NIR-FP fusion (left, mCardinal; middle, TagRFP658; right, emiRFP2), cytoplasmic mClover3, membrane targeted mScarlet, and the overall merged image (upper to lower; n = 4 fish for each subset). Imaging conditions, NIR channel: excitation 633 nm laser, emission 722/63 nm; green channel: excitation 488 nm laser, emission 513/17 nm; red channel: excitation 561 nm laser, emission 585/15 nm. Scale bars: 50 μm (overviewed images), 10 μm (higher magnified images) (d) NIR-to-green fluorescence ratio for NIR-FP expressing PCs (n = 175, 161, 192 cells for mCardinal, TagRFP658, and emiRFP2, respectively, from four fish each; imaging conditions as in (c)). Box plots with notches are used (see caption of Figure 1c for the full description). (e) Photostability curves for mCardinal (dashed line), TagRFP658 (solid line), and emiRFP (dotted line) expressed in PCs (n = 4 cells for each from one fish each) |
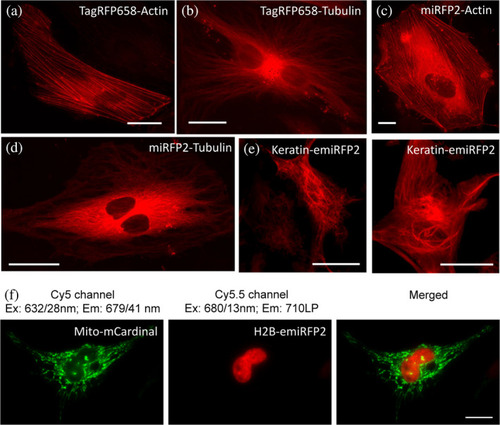
Fluorescence imaging of TagRFP658, miRFP2, and emiRFP2 fusions expressed in HeLa cells. (a–e) Representative fluorescence images of live HeLa cells transfected with (a) TagRFP658-α-Tubulin (n = 11 cells from two independent transfections) and (b) TagRFP658-β-actin (n = 19 cells from two independent transfections). (c) miRFP2-α-Tubulin (n = 15 cells from two independent transfections), (d) miRFP2-β-actin (n = 21 cells from two independent transfections), and (e) Keratin-emiRFP2 (n = 8 cells from two independent transfections). Imaging conditions: (a–d) excitation 631/28 nm from an LED, emission 664LP under wide-field microscope. (e) Excitation 640 nm from laser, emission 670–750 nm under confocal microscope. (f) Dual-color near-infrared (NIR) imaging of live HeLa cells co-expressing Mito-mCardinal and H2B-emiRFP2 (n = 12 cells from two independent transfection) |