
FIGURE 6
- ID
- ZDB-FIG-220302-91
- Publication
- Babakhanova et al., 2021 - Rapid Directed Molecular Evolution of Fluorescent Proteins in Mammalian Cells
- Other Figures
- All Figure Page
- Back to All Figure Page
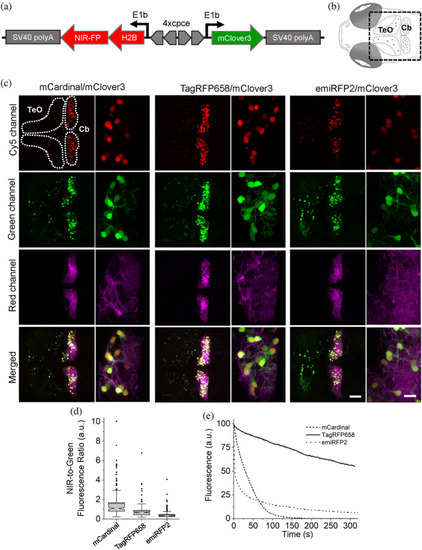
Three-color in vivo imaging of zebrafish larvae. (a) Schematic drawing of a bidirectional PC-specific expression system using 4x PC specific regulatory element (cpce) to co-express near-infrared (NIR)-FP-H2B fusion protein with mClover3. (b) Schematic drawings of dorsal view of 4 days postfertilization (dpf) larval zebrafish brain region delineating the optic tectum (TeO) and the cerebellum (Cb). The region of interest enclosed by a square was recorded in images shown below. (c) Representative confocal images of 4 dpf zebrafish larvae transiently co-expressing H2B-NIR-FP with mClover3 (expression of this construct occurs in a mosaic manner) in stable transgenic background with PC specific membrane targeted mScarlet. The TeO and the cerebellar region (Cb) are enclosed by the white dashed lines. Each subset of images (left, whole overview of tecum and cerebellar region; right, higher magnified images depicting PCs) shows the expression of each H2B-NIR-FP fusion (left, mCardinal; middle, TagRFP658; right, emiRFP2), cytoplasmic mClover3, membrane targeted mScarlet, and the overall merged image (upper to lower; n = 4 fish for each subset). Imaging conditions, NIR channel: excitation 633 nm laser, emission 722/63 nm; green channel: excitation 488 nm laser, emission 513/17 nm; red channel: excitation 561 nm laser, emission 585/15 nm. Scale bars: 50 μm (overviewed images), 10 μm (higher magnified images) (d) NIR-to-green fluorescence ratio for NIR-FP expressing PCs (n = 175, 161, 192 cells for mCardinal, TagRFP658, and emiRFP2, respectively, from four fish each; imaging conditions as in (c)). Box plots with notches are used (see caption of Figure 1c for the full description). (e) Photostability curves for mCardinal (dashed line), TagRFP658 (solid line), and emiRFP (dotted line) expressed in PCs (n = 4 cells for each from one fish each) |