
|
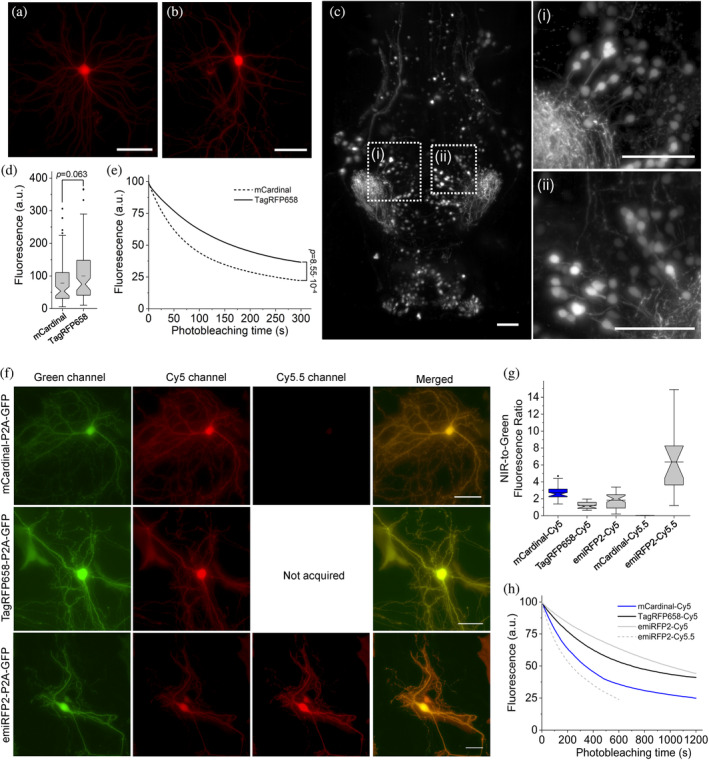
FIGURE 4 Intracellular brightness and photostability of mCardinal, TagRFP658, and emiRFP2 in live cultured hippocampal mouse neurons and in vivo in zebrafish larvae. (a,b) Representative fluorescence images of primary cultured mouse hippocampal neurons expressing TagRFP658 at (a) 14 and (b) 23 days in vitro (DIV; n = 53 and 33 neurons, respectively, from two independent cultures). Imaging condition: excitation 631/28 nm from an LED, emission 664LP. (c) Representative light sheet image of head of zebrafish larvae at 4 days postfertilization expressing TagRFP658 in neurons (n = 10 fish from two independent injections). Imaging conditions: excitation 638 nm from a laser, emission 665LP. (i, ii) High-magnification images of the respective regions shown in white boxes in e. Scale bars, 50 μm. (d) Relative fluorescence of cultured mouse hippocampal neurons expressing mCardinal and TagRFP658 (n = 78 and 85 neurons, respectively, from two independent cultures for each protein; one-way analysis of variance [ANOVA]). Imaging conditions as in (a). Box plots with notches are used in this figure (see Figure 1c for the full description). (e) Raw photobleaching curves for mCardinal (dashed line) and TagRFP658 (solid line) in primary cultured mouse hippocampal neurons (n = 9 and 7 neurons, respectively, from one culture each; one-way ANOVA). Imaging condition: excitation 631/28 nm from an LED at 70 mW/mm2, emission 664LP. (f) Representative fluorescence images of cells transfected with pAAV-CAG-mCardinal-P2A-GFP (top), pAAV-TagRFP658-P2A-GFP (middle), and pAAV-emiRFP2-P2A-GFP (n = 39, 33, and 41 neurons from three, two, and three independent transfections from one culture each for mCardinal, TagRFP658, and emiRFP2, respectively, for Cy5 channel and n = 15 and neurons from one independent transfection from one culture each for mCardinal and emiRFP2, respectively, for Cy5.5 channel). Imaging conditions: Cy5 channel: excitation 635/22 nm from 637 nm laser, emission 730/140 nm; Cy5.5 channel: excitation 680/13 nm from 680 nm laser, emission 710 LP; GFP channel: excitation 478/24 nm for an LED; emission 535/46 nm. Images in Cy5 and Cy5.5 were taken under matching excitation intensity (66 mW/mm2) and the same exposure time (100 ms). The dynamic range of fluorescence intensity in Cy5 and Cy5.5 channels are identical across all images. Scale bar, 20 μm. (g) Near-infrared (NIR)-to-green fluorescence ratio for mCardinal, TagRFP658, and emiRFP2 for the experiment shown in (f). (h) Intracellular photostability of mCardinal, TagRFP658, and emiRFP2 in Cy5 and Cy5.5 channels (n = 8, 7, and 9 neurons from three, two, and three independent transfections from one culture each for mCardinal, TagRFP658, and emiRFP2, respectively, under Cy5 excitation and n = 5 neurons from one transfection from one culture for emiRFP2 under Cy5.5 excitation). Imaging conditions the same as in (a)