
FIGURE 1
- ID
- ZDB-FIG-220302-84
- Publication
- Babakhanova et al., 2021 - Rapid Directed Molecular Evolution of Fluorescent Proteins in Mammalian Cells
- Other Figures
- All Figure Page
- Back to All Figure Page
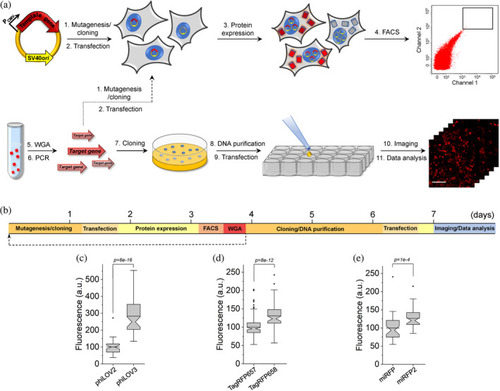
Rapid directed molecular evolution of fluorescent proteins in mammalian cells. (a) Workflow for directed evolution of proteins in HEK293FT cells using single-gene delivery via modified calcium phosphate transfection, fluorescence-activating cell sorting (FACS), and automated fluorescence imaging; WGA, whole-genome amplification. (b) Timeline of directed molecular evolution. (c) Green fluorescence of phiLOV2 and phiLOV3 expressed in HEK293FT cells (n = 40 and 59 cells, respectively, from two independent transfections for each protein; one-way analysis of variance [ANOVA] is used throughout this figure). Imaging conditions: excitation 475/34 nm from an LED, emission 527/50 nm. Box plots with notches are used throughout this paper, when n > 9 (the narrow part of notch, median; top and bottom of the notch, 95% confidence interval for the median; top and bottom horizontal lines, 25 and 75% percentiles for the data; whiskers extend 1.5× the interquartile range from the 25th and 75th percentiles; horizontal line, mean; dots represent outliers, data points which are less than the 25th percentile or greater than the 75th percentile by more than 1.5 times the interquartile range). (d) Near-infrared fluorescence of TagRFP657 and TagRFP658 expressed in HEK293FT cells (n = 181 and 76 cells, respectively, from two independent transfections for each protein). Imaging conditions: excitation 631/28 nm from an LED, emission 664LP. (e) Near-infrared fluorescence of miRFP and miRFP2 expressed in HEK293FT cells (n = 40 and 41 cells, respectively, from two independent transfections for each protein). Imaging conditions as in (d) |