
|
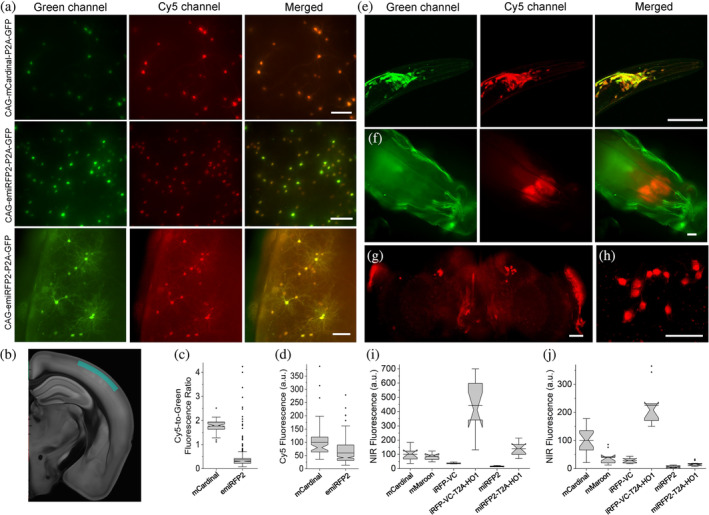
FIGURE 5 In vivo imaging and characterization of miRFP2 and emiRFP2. (a) Representative fluorescence images of live brain slices expressing mCardinal-P2A-GFP (top) and emiRFP2-P2A-GFP (middle and bottom; n = 6 slices from three mice each; L1 and L2/3 of somatosensory cortex, see Panel (b) for brain map). Imaging conditions: green channel: excitation 478/24 nm for an LED, emission 535/46 nm; Cy5 channel: excitation 635/22 nm from 637 nm laser, emission 730/140 nm. Top and middle rows of images are presented using the same dynamic range to facilitate visual comparison of mCardinal and emiRFP2 expressing neurons, bottom row images have adjusted LUTs to visualize processes of the emiRFP2 positive neurons. Scale bars, 100 μm. (b) Brain section indicating imaged region highlighted in marine blue (image from kimlab.io/brain-map). (c) Cy5-to-green fluorescence ratio of live neurons shown in (a) (n = 67 and 803 neurons from three mice each for mCardinal and emiRFP2, respectively). Imaging conditions same as in (a). (d) Cy5 mean fluorescence of live neurons shown in (a) (n = 67 and 803 neurons from three mice each for mCardinal and emiRFP2, respectively). Imaging conditions same as in (a). (e) Representative fluorescence images of the Caenorhabditis elegans head co-expressing codon-optimized genes of miRFP2-T2A-HO1 and jGCaMP7b in neurons (n = 15 worms from two independent microinjections). Imaging conditions: green channel, excitation 488 nm from a laser, emission 500–650 nm; Cy5 channel, excitation 631 nm from a laser, emission 645–700 nm. Scale bar, 50 μm. (f) Representative fluorescence images of live intact third instar Drosophila larva expressing miRFP2-T2A-HO1 (n = 10 larvae from two transgenic lines). Imaging conditions: green channel, excitation 475/34 nm from LED, emission 527/50 nm (green fluorescence corresponds to autofluorescence); Cy5 channel, excitation 631/28 nm from LED, emission 665LP. Scale bar, 100 μm. (g) Representative low-magnification fluorescence image of brain explant from adult Drosophila fly expressing codon-optimized gene of miRFP2-T2A-HO1 in R84C10-GAL4 line (n = 5 brains from one transgenic lines). Imaging conditions: excitation 635/22 nm from 637 nm laser, emission 665LP. Scale bar, 50 μm. (h) Representative high-magnification fluorescence image of brain explant from adult Drosophila fly expressing codon-optimized miRFP2-T2A-HO1 in R84C10-GAL4 line (n = 5 brains from one transgenic lines). Imaging conditions: excitation 631 nm from a laser, emission 645–700 nm. Scale bar, 50 μm. (i) Relative near-infrared (NIR) fluorescence of mCardinal, mMaroon, iRFP-VC, iRFP-VC-T2A-HO1, miRFP2, and miRFP2-T2A-HO1 expressed pan-neuronally in Drosophila third instar larvae (n = 10, 12, 7, 11, 9, and 10 larvae from one transgenic line each, respectively). Imaging conditions same as in (h). (j) Relative Cy5 fluorescence of mCardinal, mMaroon, iRFP-VC, iRFP-VC-T2A-HO1, miRFP2, and miRFP2-T2A-HO1 expressed pan-neuronally in adult Drosophila fly (n = 19, 10, 11, 11, 11, and 21 flies from one transgenic line each, respectively). Imaging conditions same as in (h)