
|
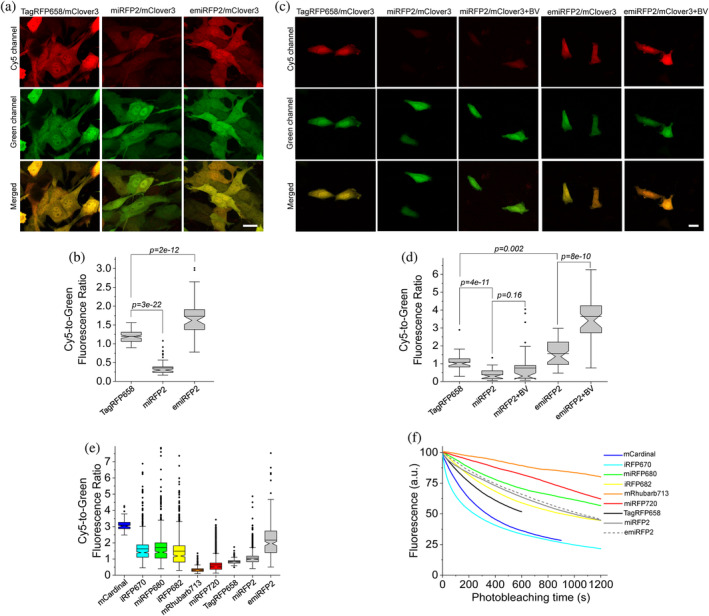
FIGURE 3 Fluorescence imaging of TagRFP658, miRFP2, and emiRFP2 expressed in mammalian and zebrafish cell cultures. (a) Representative fluorescence images of live NIH3T3 mouse embryonic fibroblasts co-expressing TagRFP658, miRFP2, and emiRFP2 with mClover3 under the EF1α:2xCMV:EF1α bidirectional promoter (n = 67, 62, and 59 cells, respectively, from one transfection each; the dynamic range of the images for the same channel was kept constant throughout the Panels (b) and (d)). Imaging conditions: Cy5 channel, excitation 633 nm from a laser, emission 660–785 nm; green channel, excitation 488 nm from a laser, emission 495–530 nm). (b) Cy5-to-green fluorescence ratio of live NIH3T3 fibroblasts shown in (a) (n = 67, 62, and 59 cells for TagRFP658, miRFP2, and emiRFP2, respectively, from one transfection each; Kruskal–Wallis analysis of variance [ANOVA]). Box plots with notches are used in this figure (see Figure 1c for the description). (c) Representative fluorescence images of live Pac2 zebrafish embryonic fibroblasts co-expressing TagRFP658, miRFP2, and emiRFP2 with mClover3 under the EF1α:2xCMV:EF1α bidirectional promoter with and without addition of 25 μM BV for 3 hr before imaging (n = 49, 36, 41, 39, and 39 cells for TagRFP658, miRFP2, miRFP2 + BV, emiRFP2, and emiRFP2 + BV, respectively, from one transfection each). Imaging conditions as in (a). (d) Cy5-to-green fluorescence ratio of live Pac2 fibroblasts shown in (c) with and without addition of 25 μM BV for 3 hr before imaging (n = 49, 36, 41, 39, and 39 cells for TagRFP658, miRFP2, miRFP2 + BV, emiRFP2, and emiRFP2 + BV, respectively, from one transfection each; Kruskal–Wallis ANOVA). Imaging conditions as in (a). Scale bars, 20 μm. (e) Cy5-to-green fluorescence ratio for near-infrared-fluorescent proteins (NIR-FPs) co-expressed with GFP via the P2A peptide in live HEK cells (n = 144; 775; 612; 837; 446; 2,937; 226; 1,981; and 271 cells for mCardinal, iRFP670, miRFP680, iRFP682, mRhubarb713, miRFP720, TagRFP658, miRFP2, and emiRFP2, respectively, from two independent transfections each). Box plots with notches are used in this figure (see Figure 1c for the full description). Imaging conditions: Cy5 fluorescence, excitation 635/22 nm from 637 nm laser, emission 730/140 nm; green fluorescence, excitation 478/24 nm for an LED; emission 535/46 nm. (f) Photobleaching curves for NIR-FPs expressed in live HEK cells under continuous wide-field illumination from 637 nm laser at 66 mW/mm2 (n = 55, 32, 10, 43, 32, 48, 56, 38, and 37 cells for mCardinal, iRFP670, miRFP680, iRFP682, mRhubarb713, miRFP720, TagRFP658, miRFP2, and emiRFP2, respectively, from two independent transfections each)