
- Title
-
Regenerative Polarity of the Fin Ray in Zebrafish Caudal Fin and Related Tissue Formation on the Cut Surface
- Authors
- Nakajima, W., Nakanishi, S., Hosoya, R., Uemoto, T., Ohgo, S., Wada, N.
- Source
- Full text @ J Dev Biol
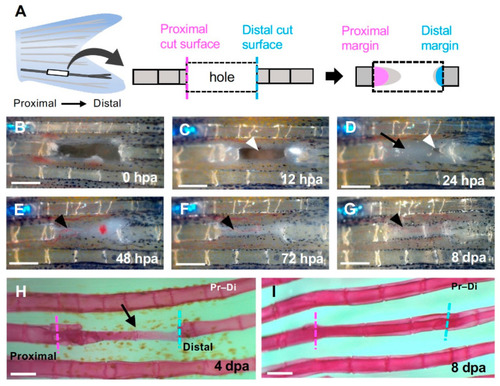
Regeneration of the hole induced by partial excision of the fin ray. (A) Schematic diagram of fin ray hollowing. Three to four segments were hollowed out to exclude the branching area (left). The regenerated structures formed from the cells that were distributed on the proximal (magenta) or distal (cyan) surfaces of the hollowed-out hole were investigated (center and right). (B–G) Time course of regeneration in the hole. (B) 0 h post-amputation (hpa); (C) 12 hpa; (D) 24 hpa; (E) 48 hpa; (F) 72 hpa and (G) 8 days post-amputation (dpa). (C) At 12 hpa, the hole remained open (arrowhead). (D) At 24 hpa, the hole was almost covered by epithelium (arrow) except for a small portion near the distal surface (arrowhead). (E–G) At 48 hpa and later, precursor tissue of the fin ray was extended from the proximal side (black arrowheads). (H) At 4 dpa, a fin ray primordium was formed from the proximal to distal edge (black arrow). (I) At 8 dpa, segments were observed and regeneration was complete. Scale bars = 300 μm. |
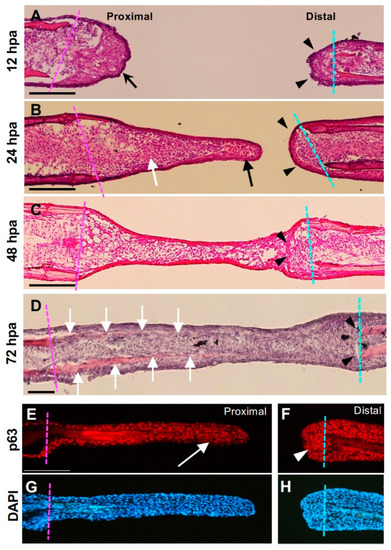
Histological analysis of the hole excision site. (A–D) Hematoxylin–eosin–stained images after fin ray hollowing. The magenta dotted line indicates the cut surface of the proximal part, and the cyan dotted line indicates the cut surface of the distal part. (A) At 12 h post-amputation (hpa), the proximal surface of the hole was covered with thick epithelium (arrow), whereas the distal surface was covered with thin epithelium (arrowhead). (B) At 24 hpa, the extended tissue was at the proximal cut surface of the hole. The apical part of the tissue mainly consisted of the epithelial sheet (arrows), and some mesenchymal cells beneath the sheet were also visible. By contrast, the distal cut surface was covered with a thin epithelial sheet and was not elongated (arrowheads). (C) The epithelium and mesenchyme extending from the proximal surface of the hole connected with those in the distal surface. At the junction, epithelial-like cellular fragments derived from the distal surface remained (arrowheads). At this stage, bone formation had not occurred. Scale bars = 300 μm. (D) At 72 hpa, newly formed bone tissue was observed from the proximal edge toward the tip (arrows), whereas no regenerated bone was observed from the distal cut surface. (E) Distribution of the p63 protein in regenerated tissue from the proximal margin. In the apical half of the tissue, there was a layer of p63-positive epithelial cells (arrow). (F) Distribution of p63 in the distal margin. Although accumulation of p63-positive cells was visible (arrowhead), they do not extend proximally. (G,H) are DAPI staining views of (E,F), respectively. |
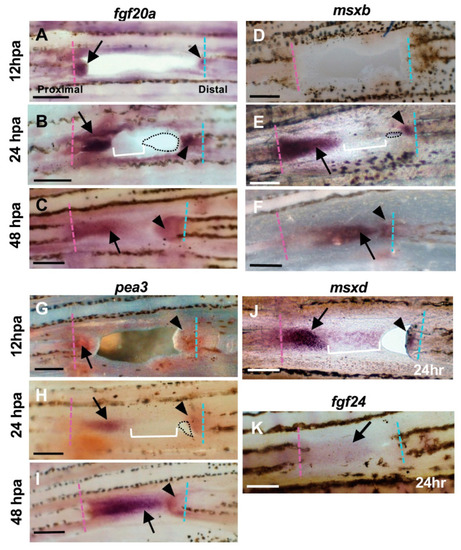
Expression of regeneration-related genes during hole closure. (A–C) fgf20a expression. (A) At 12 h post-amputation (hpa). The fgf20a expression was observed in the cells of the proximal margin (arrow), and distal margin (arrowhead) of the hole. (B) At 24 hpa. In the proximal margin, fgf20a was strongly expressed in the cells of the inner half of the regenerated tissue (arrow), whereas the expression was faint in the apical half of the tissue (bracket). In the distal margin, fgf20a expression was also observed, but the area of expression was small (arrowhead). Dotted lines show the remaining hole. (C) At 48 hpa. The fgf20a expression was maintained in both proximal- and distal-derived tissues (arrow and arrowhead, respectively), and both domains were close together. (D–F) msxb expression. (D) At 12 hpa, msxb was not expressed. (E) At 24 hpa, in the proximal margin, msxb was strongly expressed in the cells near the cut surface of the regenerated tissue (arrow). The expression was faint in the distal half of the tissue that filled the hole (bracket). In the distal margin, msxb expression was restricted to a small area (arrowheads). Dotted lines show the remaining hole. (F) At 48 hpa, msxb was maintained in both proximal- and distal-derived tissues (arrow and arrowhead, respectively). (G–I) pea3 expression. (G) At 12 hpa, pea3 expression was observed in the cells both in the proximal and distal margins of the hole (arrow and arrowhead, respectively). (H) At 24 hpa, pea3 was expressed in the cells of the inner half of the regenerated tissue in the proximal margin (arrow), whereas the expression was weakened in the apical half of the tissue (brackets). In the distal margin, pea3 expression was also observed, although the expression domain was small (arrowhead). Dotted lines show the remaining hole. (I) At 48 hpa, pea3 expression was maintained in both proximal- and distal-derived tissues (arrow and arrowhead, respectively). (J) msxd expression at 24 hpa. In the proximal margin, msxd was strongly expressed in the cells of the inner half of the regenerated tissue (arrow), whereas the expression was weakened in the apical half of the tissue (bracket). In the distal margin, msxd expression was also observed, but the area of expression was restricted (arrowhead). (K) fgf24 expression at 24 hpa. The fgf24 was weakly expressed in the epithelium of the regenerated tissue from the proximal margin (arrow). Expression in the distal margin was unclear. Scale bars = 300 μm. |
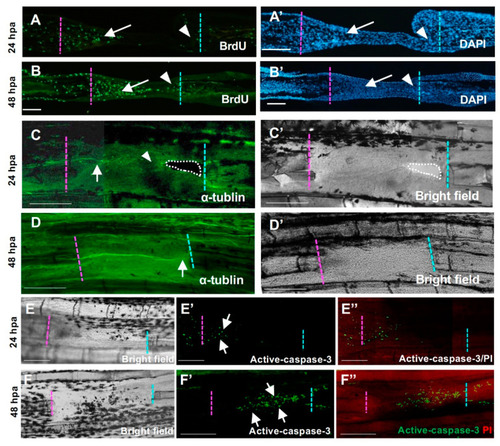
Cellular responses during hole regeneration. (A,A’,B,B’) BrdU-positive cells during hole regeneration. (A) At 24 h post-amputation (hpa), high proliferation of mesenchymal cells was observed in the proximal-derived tissue (arrow), but few cells were observed in the distal side (arrowhead). (B) At 48 hpa, high proliferation of mesenchymal cells was maintained, and proliferation of epithelial cells was also detected. In the distal tissue, some cells were also BrdU-positive (arrowhead). (A’) and (B’) are DAPI staining of (A,B), respectively. Scale bars = 100 μm. (C,C’,D,D’) Nerve distribution during hole regeneration. (C,C’) 24 hpa. (C′) is the bright field view of (C). The nerve fiber extended from the proximal end to the regenerative tissue (arrow). By contrast, few nerve fibers were detected in the apical half of the epithelial sheet and the distal cut end (arrowhead). (D,D’) 48 hpa. (D’) is the bright field view of (D). Several nerve fibers extended from the proximal cut end to the distal cut end (arrow). Scale bars = 300 μm. (E,E’,F,F’) Apoptosis during hole regeneration. (E,F) Bright field. (E’,F’) Active caspase-3. (E”,F”) Merged images of active caspase-3 and propidium iodide (PI) staining. (E,E’,E”) At 24 hpa, apoptosis was only observed in the epithelium covering the blastema formed on the surface of the proximal side (arrow, n = 3). (F,F’,F”) At 48 hpa, apoptotic cells were observed in the tissue derived from the proximal surface (arrow, n = 3). Resection edges (dotted lines). Scale bars = 100 μm (A,B), 300 μm (C,D). |
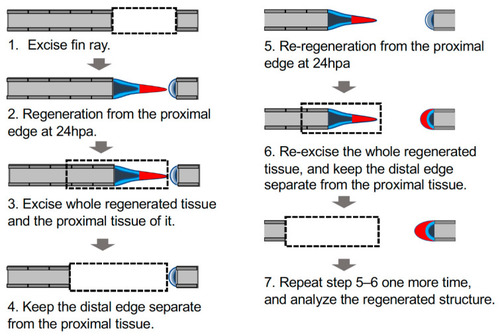
Schema of manipulation to investigate autonomous sheet-like tissue formation in the distal margin. Schema of the experimental procedure; the detailed procedure is described in the Materials and Methods section. Dashed rectangles indicate excision sites of the fin ray; gray, fin ray; light blue, epithelium of the cut surface; dark blue, mesenchyme of the cut surface; red, the sheet-like tissue formed on the proximal margin (triangle) or an equivalent structure on the distal margin (crescent shape). |
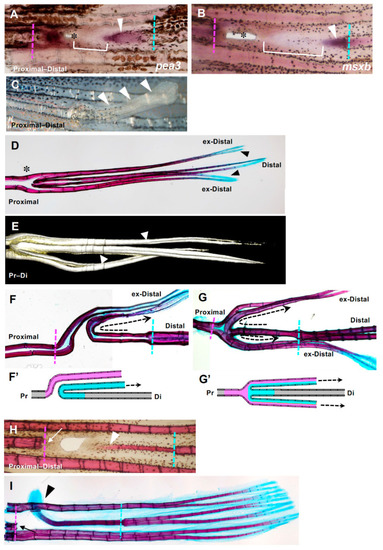
Fin ray regeneration of fin ray from the distal margin of the hole. (A,B) Strong expression of both msxb and pea3 was observed at both the proximal and distal sides. Arrowheads indicate gene expression that was extended from the distal side to the proximal side. In addition, a distal margin-derived sheet-like tissue was observed (yellow brackets). (C) Seven days after excision, a rod-like lateral protrusion was formed from the position of the hole closure (arrowheads). (D) An example of the skeletal pattern that was fully regenerated from a hole-excised caudal fin. The original and regenerated fin rays are shown. Regenerated fin rays laterally protruded from the position of the hole with extra branching (asterisk). The distal ends of the regenerated fin rays (indicated as ex-distal) reached the same length as the original fin ray and were stained with alcian blue (arrowheads). (E) A 3D reconstruction of the regenerated extra fin ray shown in (D) using the COMBI method. Bifurcation of the regenerated fin ray was observed (arrows). (F,G) Examples of the skeletal pattern at the branching position of the hole-excised caudal fin. The direction of the regenerated fin ray extending from the distal margin is indicated with dotted arrows. (F’) and (G’) are schema that represent the fin ray patterns shown in (F,G), respectively. In the schema, fin rays regenerated from the distal margin are indicated in blue, and those regenerated from the proximal margin are indicated in pink. In (F) the fin ray that regenerated from the distal margin protruded to either side of the fin at the position where it collided with the fin ray that regenerated from the proximal margin, and then bent distally (n = 3/9). In (G) a hemi-ray of the distal-derived fin ray and that of the proximal-derived fin ray merged to form one fin ray and protruded to both sides of the fin (n = 6/9). (H,I) A fin ray regenerated from a distal margin after prolonged and repeated excision of tissue at the proximal margin of the hole. (H) After one week, the regenerated fin ray was formed in the same plane of the original fin rays and as a continuous structure of the proximal edge of the original fin ray (arrowhead, n = 3). (I After 2 weeks of regeneration, the distal end of the regenerated fin ray protruded laterally (arrowhead, n = 3). The distal end was stained with alcian blue (arrowhead), as was the original fin ray. During the regeneration process from the distal cut edge, regeneration from the proximal margin did not occur because of repeated excision (arrows). |