
|
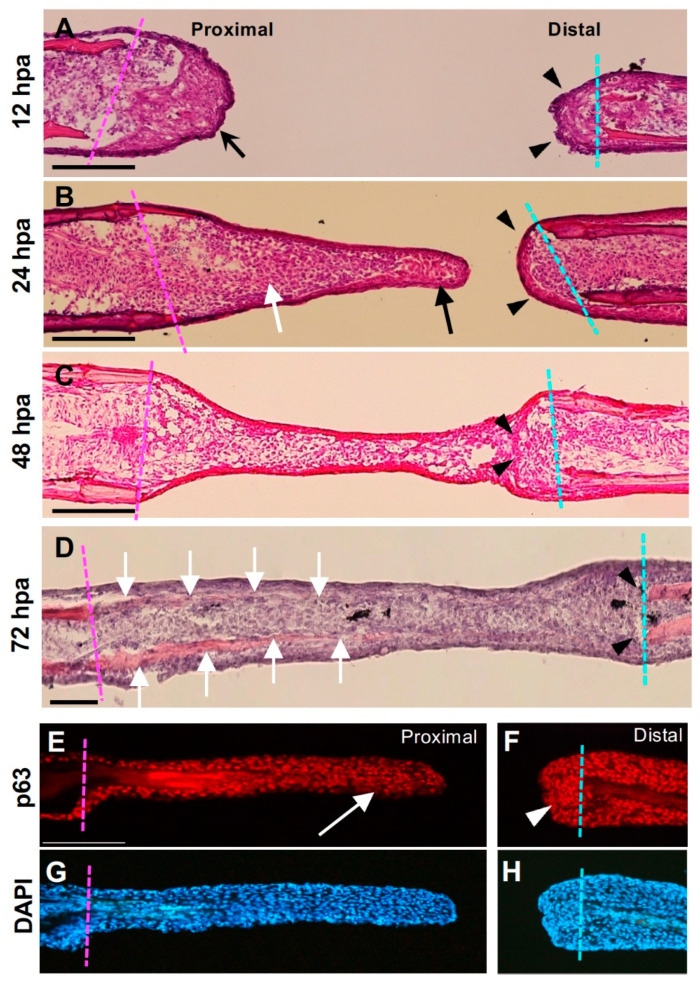
Figure 2
Histological analysis of the hole excision site. (A–D) Hematoxylin–eosin–stained images after fin ray hollowing. The magenta dotted line indicates the cut surface of the proximal part, and the cyan dotted line indicates the cut surface of the distal part. (A) At 12 h post-amputation (hpa), the proximal surface of the hole was covered with thick epithelium (arrow), whereas the distal surface was covered with thin epithelium (arrowhead). (B) At 24 hpa, the extended tissue was at the proximal cut surface of the hole. The apical part of the tissue mainly consisted of the epithelial sheet (arrows), and some mesenchymal cells beneath the sheet were also visible. By contrast, the distal cut surface was covered with a thin epithelial sheet and was not elongated (arrowheads). (C) The epithelium and mesenchyme extending from the proximal surface of the hole connected with those in the distal surface. At the junction, epithelial-like cellular fragments derived from the distal surface remained (arrowheads). At this stage, bone formation had not occurred. Scale bars = 300 μm. (D) At 72 hpa, newly formed bone tissue was observed from the proximal edge toward the tip (arrows), whereas no regenerated bone was observed from the distal cut surface. (E) Distribution of the p63 protein in regenerated tissue from the proximal margin. In the apical half of the tissue, there was a layer of p63-positive epithelial cells (arrow). (F) Distribution of p63 in the distal margin. Although accumulation of p63-positive cells was visible (arrowhead), they do not extend proximally. (G,H) are DAPI staining views of (E,F), respectively.