
|
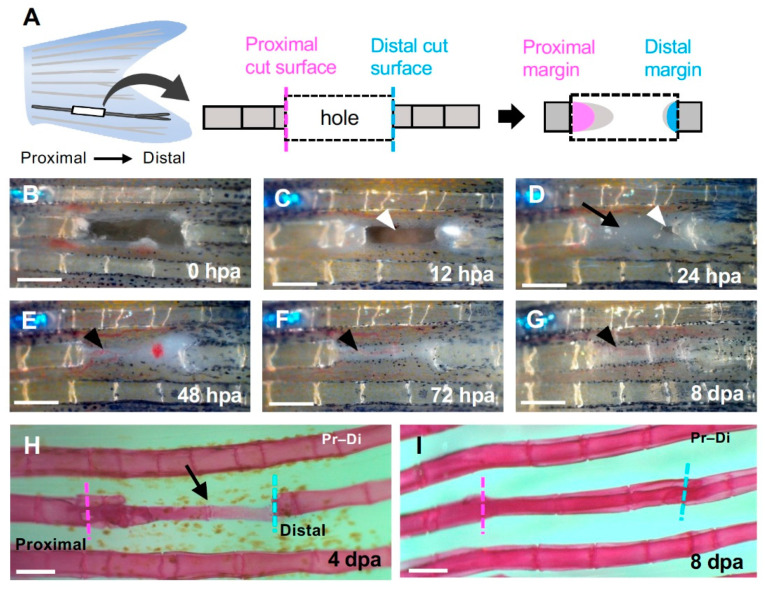
Figure 1
Regeneration of the hole induced by partial excision of the fin ray. (A) Schematic diagram of fin ray hollowing. Three to four segments were hollowed out to exclude the branching area (left). The regenerated structures formed from the cells that were distributed on the proximal (magenta) or distal (cyan) surfaces of the hollowed-out hole were investigated (center and right). (B–G) Time course of regeneration in the hole. (B) 0 h post-amputation (hpa); (C) 12 hpa; (D) 24 hpa; (E) 48 hpa; (F) 72 hpa and (G) 8 days post-amputation (dpa). (C) At 12 hpa, the hole remained open (arrowhead). (D) At 24 hpa, the hole was almost covered by epithelium (arrow) except for a small portion near the distal surface (arrowhead). (E–G) At 48 hpa and later, precursor tissue of the fin ray was extended from the proximal side (black arrowheads). (H) At 4 dpa, a fin ray primordium was formed from the proximal to distal edge (black arrow). (I) At 8 dpa, segments were observed and regeneration was complete. Scale bars = 300 μm.