
- Title
-
Differential Responses of Neural Retina Progenitor Populations to Chronic Hyperglycemia
- Authors
- Schmitner, N., Recheis, C., Thönig, J., Kimmel, R.A.
- Source
- Full text @ Cells

ZFIN is incorporating published figure images and captions as part of an ongoing project. Figures from some publications have not yet been curated, or are not available for display because of copyright restrictions. PHENOTYPE:
|
|
ZFIN is incorporating published figure images and captions as part of an ongoing project. Figures from some publications have not yet been curated, or are not available for display because of copyright restrictions. PHENOTYPE:
|
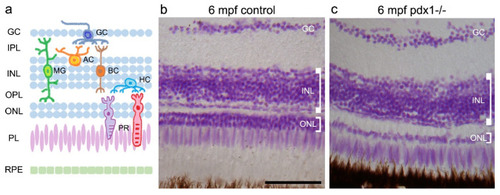
Pathology in the neural retina of pdx1−/− mutants at 6 mpf. (a) Schematic showing the locations of the cell types of the neural retina. Feulgen staining of cryosections of control (b) and pdx1 mutant (c) zebrafish. Scale bar: 50 µm. (GC, ganglion cell layer; IPL, inner plexiform layer; INL, inner nuclear layer; OPL, outer plexiform layer; ONL, outer nuclear layer; PL, photoreceptor layer; RPE, retinal pigment epithelium; AC, amacrine cell; MG, Müller glial cell; BC, bipolar cell; HC, horizontal cell; PR, photoreceptor). PHENOTYPE:
|
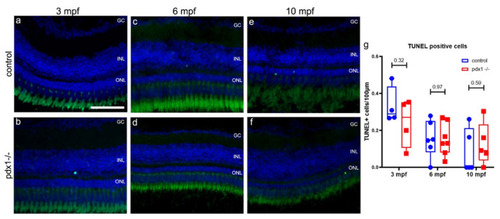
Hyperglycemia does not lead to increased cell death in the neural retina of pdx1−/− mutants. Cryosections of retina at 3 (a,b), 6 (c,d) and 10 (e,f) mpf from control and pdx1−/− mutants labeled by TUNEL staining (green) and counterstained with DAPI (blue). (g) Quantification of TUNEL positive nuclei in all layers of the retina. Box plot extends from 75% to 25%, showing all data points, line indicates median, n = 4–7 fish per time point. Scale bar: 50 µm. (GC, ganglion cell layer; INL, inner nuclear layer; ONL, outer nuclear layer). PHENOTYPE:
|
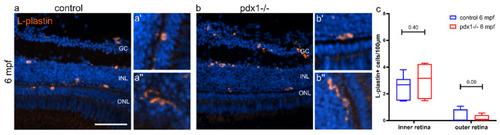
Immunolocalization of immune cells in the retina of control and pdx1−/− mutant zebrafish. Cryosections of 6 mpf control (a) and pdx1−/− mutant (b) retinas stained for L-plastin (orange) and counterstained with DAPI (blue). Close-up images of compact and round (a′,b′) versus elongated (a″,b″) L-plastin labeled cells found in control (a′,a″) and pdx1−/− mutants (b′,b″). (c) Quantification of L-plastin positive cells in the inner and the outer retina (for details see Materials and Methods). Box plot extends from 75% to 25%, whiskers showing minimum and maximum, line indicates median, n = 7 controls, 6 pdx−/−. Scale bar: 50 µm. (GC, ganglion cell layer; INL, inner nuclear layer; ONL, outer nuclear layer;). |

Chronic hyperglycemia impacts proliferation in progenitor populations. Cryosections of control and pdx1−/− retinas at 3 mpf (a), 6 mpf (b) and 10 mpf (c). Cryosections were stained for EdU to identify cells that underwent proliferation (green) and counterstained with DAPI (blue). (d,e) Quantification of EdU positive cells in the ciliary marginal zone (CMZ) depicted in a box plot (d) and the same data shown as a line plot over time (e). Quantification of EdU positive cells in the ONL (f) and the INL (g) at 3, 6 and 10 mpf. Box plot extends from 75% to 25%, showing all data points, line indicates median. n = 4–10 fish per time point. Scale bar: 50 µm. (GC, ganglion cell layer; INL, inner nuclear layer; ONL, outer nuclear layer). PHENOTYPE:
|
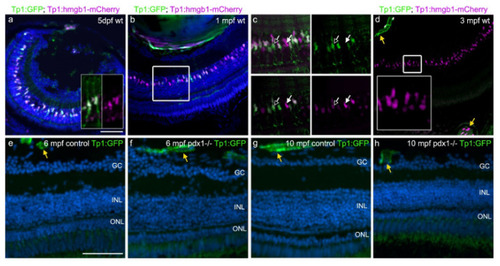
Notch signaling is not re-activated during chronic hyperglycemia. (a–d) Tg(tp1:GFP;tp1:hmgb1-mCherry) double transgenic 5 dpf larvae (a) and adults (b–d) showed gradual loss of GFP expression in the INL over time, while hmgb1-mCherry expression labeled cells in the INL through adulthood. In some GFP-positive cells at 5 dpf, projections extend along the apical–basal axis (a, inset). In (c), which shows a close-up of the boxed region in (b), GFP and mCherry variably overlap in INL nuclei. At 3 mpf, INL cells show variable levels of mCherry, and are GFP negative (d, inset). GFP and mCherry are coexpressed in retinal and choroidal vessels (d, yellow arrows). (e–h) In 6 mpf (e,f) and 10 mpf (g,h) control and pdx1−/− mutants, GFP expression via notch-responsive elements cannot be detected in the neural retina. Expression is limited to retinal and choroidal vessels (yellow arrows). Sections were counterstained with DAPI (blue). Scale bar: 50 µm. (GC, ganglion cell layer; INL, inner nuclear layer; ONL, outer nuclear layer). |

pax6-expressing progenitors are not increased in chronic hyperglycemia. Tg(pax6b:dsRed) labeled cells (magenta) in the INL (a,b) and the CMZ (e,f) in 3 mpf control and pdx1−/− mutant retinas. Proliferating cells are labeled through EdU incorporation (green). In 6 mpf controls (c,g) and pdx1−/− mutants (d,h), pax6b:dsRed expression was not observed in the central area of the retina and was limited to few cells in the CMZ. In situ hybridization for pax6a stained cells in the basal portion of INL in the central area of the retina (i–l) and in the CMZ (i′–l′) in controls (i,i′,k,k′) and pdx1−/− mutants (j,j′,l,l′) at 3 mpf and 6 mpf. Scale bar: 50 µm. (GC, ganglion cell layer; INL, inner nuclear layer; ONL, outer nuclear layer). |
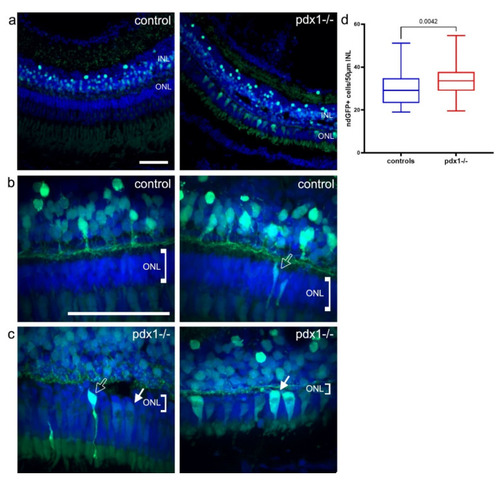
Photoreceptors are restored from neurod-expressing progenitors. (a–c) In neurod:GFP transgenics, strong GFP is detected mainly in the INL in controls, and in the INL and ONL of pdx1 mutants (a). In controls, neurod:GFP labeled rod-shaped cells in the ONL were observed. In pdx1−/− mutants, neurod:GFP labeled rod and cone shaped cells in the ONL in most mutants (b,c, see Table 2). Sections were counterstained with DAPI (blue). A significant increase in GFP positive cells in the INL was detected in pdx1−/− mutants (d). Box plot extends from 75% to 25%, whiskers showing minimum and maximum, line indicates median, n = 10 controls, 9 pdx1−/−. Scale bar: 50 µm. (INL, inner nuclear layer; ONL, outer nuclear layer). |
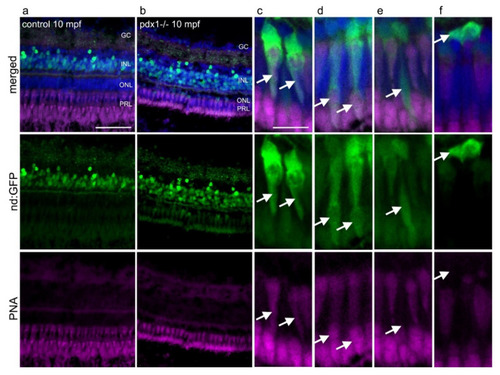
neurod:GFP expressing progenitors give rise to cones and rods in pdx−/− diabetic zebrafish. Expression of GFP in tg(neurod:GFP) in the INL in control fish (a) and in the INL and in the ONL in pdx1−/− fish (b). (c–f) Higher magnification views of photoreceptors from pdx1−/− samples as in (b). GFP expression overlaps with PNA in cells with cone morphology (c,d, arrows), while rod-shaped cells (e, arrow) are PNA negative. Compact cells located basally in the ONL, presumed to be undifferentiated, do not label with PNA (f, arrow). Sections were counterstained with DAPI (blue). Scale bar: 50µm in a and b and 10µm in (c–f). (INL, inner nuclear layer; ONL, outer nuclear layer; PRL, photoreceptor layer). EXPRESSION / LABELING:
|
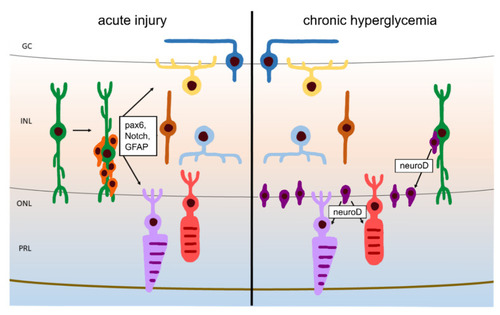
Our proposed model of regeneration during chronic hyperglycemia versus regeneration upon acute injury. Following acute injury, activated Müller glia divide to produce multipotent progenitors that can give rise to all neuronal cell types. Under conditions of chronic hyperglycemia, lost photoreceptors are replenished through neurod-expressing progenitors that likely arise in the INL. Unlike the classically described “rod progenitors”, these proliferative progenitors give rise to both rods and cones. |