|
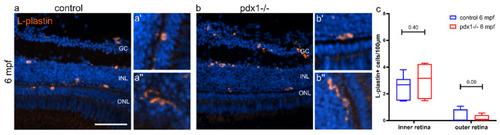
Immunolocalization of immune cells in the retina of control and pdx1−/− mutant zebrafish. Cryosections of 6 mpf control (a) and pdx1−/− mutant (b) retinas stained for L-plastin (orange) and counterstained with DAPI (blue). Close-up images of compact and round (a′,b′) versus elongated (a″,b″) L-plastin labeled cells found in control (a′,a″) and pdx1−/− mutants (b′,b″). (c) Quantification of L-plastin positive cells in the inner and the outer retina (for details see Materials and Methods). Box plot extends from 75% to 25%, whiskers showing minimum and maximum, line indicates median, n = 7 controls, 6 pdx−/−. Scale bar: 50 µm. (GC, ganglion cell layer; INL, inner nuclear layer; ONL, outer nuclear layer;).
|