
- Title
-
Commensal bacteria augment Staphylococcus aureus infection by inactivation of phagocyte-derived reactive oxygen species
- Authors
- Gibson, J.F., Pidwill, G.R., Carnell, O.T., Surewaard, B.G.J., Shamarina, D., Sutton, J.A.F., Jeffery, C., Derré-Bobillot, A., Archambaud, C., Siggins, M.K., Pollitt, E.J.G., Johnston, S.A., Serror, P., Sriskandan, S., Renshaw, S.A., Foster, S.J.
- Source
- Full text @ PLoS Pathog.
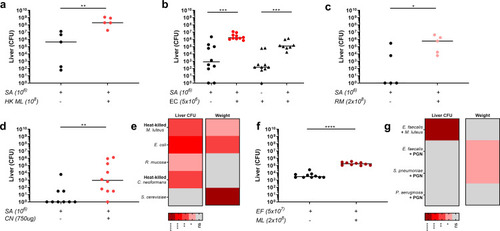
Breadth of the augmentation phenomenon, from S. aureus to other pathogens.
Co-injection of low dose S. aureus (SA 1x10⁶ CFU) with heat-killed M. luteus (HK ML equivalent of 1x10⁸ CFU) into mice: liver CFU (n = 5 per group, median value shown, two-tailed Mann-Whitney test), **p<0.008 B Co-injection of low dose S. aureus (SA 1x10⁶ CFU) with E. coli (EC 5x10⁶ CFU) into mice: liver CFU, S. aureus, circles; E. coli triangles (n = 8–10 per group, median value shown, two individual two-tailed Mann-Whitney tests), ***p<0.0003 C Co-injection of low dose S. aureus (SA 1x10⁶ CFU) with R. mucosa (RM 2x10⁸ CFU) into mice: liver CFU (n = 5 per group, median value shown, two-tailed Mann-Whitney test), *p<0.05 D Co-injection of low dose S. aureus (SA 1x10⁶ CFU) with heat-killed C. neoformans (CN 750 μg) into mice: liver CFU (n = 9–10 per group, median value shown, two-tailed Mann-Whitney test), **p<0.006 E Summary heat-map for microorganisms tested for augmenting ability in S. aureus infection, showing significant changes in liver CFUs and weight change F Co-injection of low dose E. faecalis (EF 5x10⁷ CFU) with M. luteus (ML 2x10⁸ CFU) into mice: liver CFU (n = 10 per group, median value shown, two-tailed Mann-Whitney test), ****p<0.0001 G Summary heat-map of alternative pathogens tested for ability to be augmented, with addition of PGN or M. luteus, showing significant changes in liver CFUs and weight change. In all cases liver CFUs were enumerated at 3 days post-infection. |
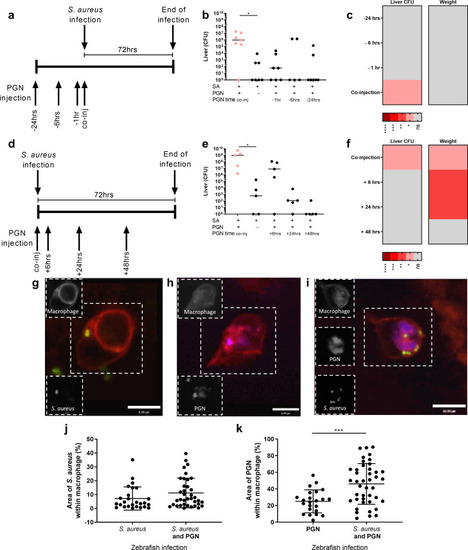
Augmenting material must be present at the same time and location as S. aureus to enhance infection.
A-C Mice were intravenously injected with 500 μg M. luteus PGN 24 hours, 6 hours or 1 hour before infection with 1x10⁶ S. aureus, or at the same time as S. aureus, or with S. aureus alone A Diagram of experimental protocol B liver CFUs, enumerated at 72 hpi (n = 7 per group, median value shown, Kruskal-Wallis test with Dunn’s post-test), *p<0.05 C Summary heat-map for augmenting ability of PGN added before S. aureus infection, showing significant changes in liver CFUs and weight change D-F Mice were intravenously injected with 500 μg M. luteus PGN 48 hours, 24 hours or 6 hours after infection with 1x10⁶ S. aureus, or at the same time as S. aureus, or with S. aureus alone D Diagram of experimental protocol E liver CFUs, enumerated at 72 hpi (n = 5 per group, median value shown, Kruskal-Wallis test with Dunn’s post-test) *p<0.05 F Summary heat-map for augmenting ability of PGN added after S. aureus infection, showing significant changes in liver CFUs and weight change G-K Zebrafish larvae injected with 400 CFU S. aureus, 5 ng of M. luteus PGN, or both. The larvae have fluorescent macrophages (red) and were injected with fluorescent S. aureus (green) and/or fluorescently labelled M. luteus PGN (blue) G-I Images of infected larvae at 2 hpi showing macrophages containing S. aureus, scale 6.9 μm, greyscale insets depict location of fluorescence signal within the hatched box of the main image, for ease of visualisation (G), M. luteus peptidoglycan scale 6.9 μm (H), or both scale 10 μm (I), J Area of macrophage taken up by S. aureus at 2 hpi (n = 3, 14–21 larvae per group, unpaired t-test) K Area of macrophage taken up by M. luteus PGN at 2hpi (n = 3, 11–21 larvae per group, two-tailed unpaired t-test, ***p<0.0004). |
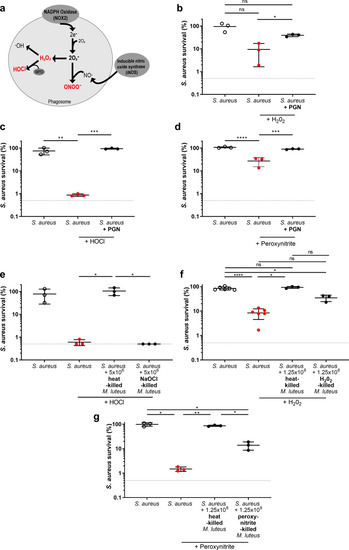
Augmenting material protects S. aureus from ROS in vitro.
A Reactive oxygen species generated in the oxidative burst, ROS highlighted in red are examined B-D Following ROS exposure, percentage survival of S. aureus alone (5x10⁴ CFU/mL), or with M. luteus PGN (1.25 mg) B hydrogen peroxide (n = 3, error bars show mean +/- SD, one-way ANOVA test with Tukey’s post hoc test) *p<0.05 C sodium hypochlorite (n = 3, error bars show mean +/- SD, one-way ANOVA test with Tukey’s post hoc test), **p<0.01; ***p<0.005 D peroxynitrite (n = 3, error bars show mean +/- SD, one-way ANOVA test with Tukey’s post hoc test), ***p<0.005; ****p<0.0001 E Following sodium hypochlorite exposure, percentage survival of S. aureus alone (5x10⁴ CFU/mL), with heat-killed M. luteus (equivalent of 5x10⁶ CFU/mL) or ROS killed M. luteus (equivalent of 5x10⁶ CFU/mL) (n = 3, error bars show mean +/- SD, one-way ANOVA test with Tukey’s post hoc test), *p<0.05 F-G Following ROS exposure, percentage survival of S. aureus alone (5x10⁴ CFU/mL), with heat-killed M. luteus (equivalent of 1.25x10⁸ CFU/mL), or ROS killed M. luteus (equivalent of 1.25x10⁸ CFU/mL) F hydrogen peroxide (n = 3, +/-SD, one-way ANOVA test with Tukey’s post hoc test), *p<0.05; ****p<0.0001 G peroxynitrite (n = 3, +/-SD one-way ANOVA test with Tukey’s post hoc test), *p<0.05; **p<0.003. |

S. aureus strains susceptible to ROS are augmented in vitro and in vivo.
A Reactive oxygen species generated in the oxidative burst, highlighting where KatA and AhpC action occurs B Following hydrogen peroxide exposure, percentage survival of S. aureus katAahpC mutants alone (5x10⁴ CFU/mL), or with live M. luteus (5x10⁶ CFU/mL), heat-killed M. luteus (equivalent of 5x10⁶ CFU/mL) or ROS killed M. luteus (equivalent of 5x10⁶ CFU/mL), (n = 3, error bars show mean +/- SD, one-way ANOVA test with Tukey’s post hoc test), ***p<0.0002; ****p<0.0001 C Co-injection of low dose S. aureus katAahpC (1x10⁶ CFU) with heat-killed M. luteus (equivalent of 1x10⁸ CFU) into mice: liver CFU, enumerated at 3 days post-infection (n = 5 per group, median value shown, two-tailed Mann-Whitney test), *p<0.05 D Co-injection of low dose S. aureus (SA 2x10⁵ CFU) with M. luteus PGN (ML PGN 500 μg) into wild-type (WT) control mice or MPO-/- mice: liver CFU, enumerated at 3 days post-infection (n = 9 per group, median value shown, individual two-tailed Mann-Whitney tests), *p<0.05, **p<0.002, ***p<0.0006. |
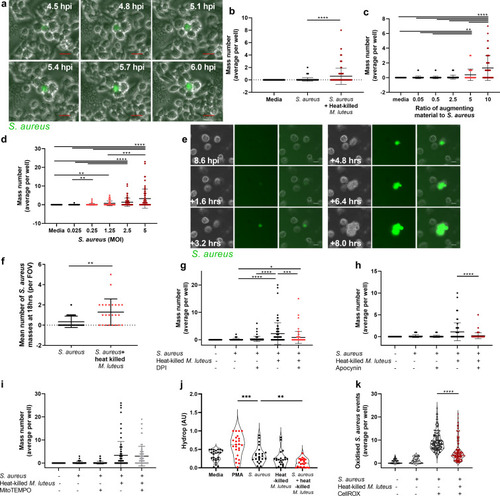
Augmenting material protects S. aureus from reactive oxygen species in macrophages.
A Images of GFP-S. aureus mass formation within RAW264.7 cells, scale 20 μm B RAW264.7 cells infected with GFP S. aureus (MOI 5) with or without heat-killed M. luteus (MOI 50), (n = 4), ****p<0.0001 C RAW264.7 cells infected with GFP S. aureus (MOI 5) with or without heat-killed M. luteus (ratio to S. aureus, 10, 5, 2.5, 0.5 or media control), (n = 4), **p<0.008; ****p<0.0001 D RAW264.7 cells infected with GFP S. aureus (MOI 5, 2.5, 1.25, 0.25, 0.025 or media control) with or without of heat-killed M. luteus (MOI 50), (n = 4), **p<0.003; ***p<0.0008; ****p<0.0001 E-F MDMs infected with GFP S. aureus (MOI 5) with or without heat-killed M. luteus (MOI 50) E images of GFP S. aureus mass formation within human MDMs, scale 20 μm F number of S. aureus masses observed (n = 3), **p<0.003 G RAW264.7 cells infected with GFP S. aureus (MOI 5) in the presence or absence of heat-killed M. luteus (MOI 50), either with or without DPI (2 μM), (n = 4), *p<0.05;***p<0.0004; ****p<0.0001 H RAW264.7 cells infected with GFP S. aureus (MOI 5) in the presence or absence of heat-killed M. luteus (MOI 50), either with or without apocynin (500 μM), (n = 4), ****p<0.0001 I RAW264.7 cells infected with GFP S. aureus (MOI 5) in the presence or absence of heat-killed M. luteus (MOI 50), either with or without mitoTEMPO (1 μM), (n = 4, non-significant) J RAW264.7 cells infected with GFP S. aureus (MOI 5) with or without heat-killed M. luteus (MOI 50) with Hydrop used to visualise hydrogen peroxide (n = 4, violin plot with median values shown), **p<0.007; ***p<0.0004 K RAW264.7 cells infected with CellROX-stained GFP S. aureus (MOI 50) to visualise intracellular oxidation in the presence or absence of heat-killed M. luteus (MOI 50), (n = 4, violin plot with median values shown), ****p<0.0001. In panels B, F, H, I and K, a two-tailed Mann Whitney test was used, in panels C, D, G, and J, a Kruskal-Wallis test with Dunn’s post hoc test was used. Where used, error bars show mean +/- SD. |
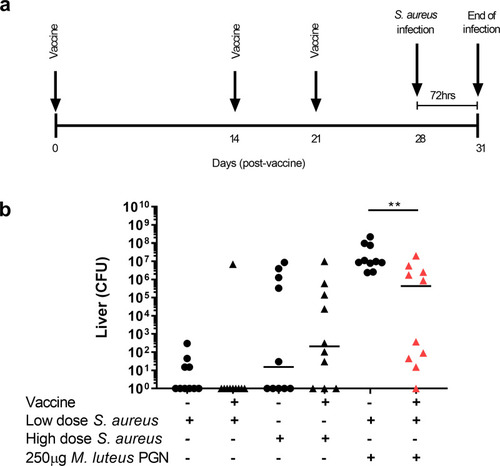
Vaccination reduces augmented infection.
A-B Mice were vaccinated subcutaneously on day 0, 14 and 21 with vaccine (1 μg ClfA, 50 μg CpG and 1% w/v Alhydrogel, triangles) or PBS control (circles). Day 28 post-vaccination mice were intravenously injected with low dose S. aureus (1x10⁶ CFU) high dose S. aureus (1x10⁷ CFU), with both low dose S. aureus and 250 μg M. luteus PGN A diagram of experimental protocol B liver CFUs, enumerated 72 hpi (n = 10 per group, median value shown, two-tailed Mann-Whitney test), **p<0.002. |