
|
Fig 2
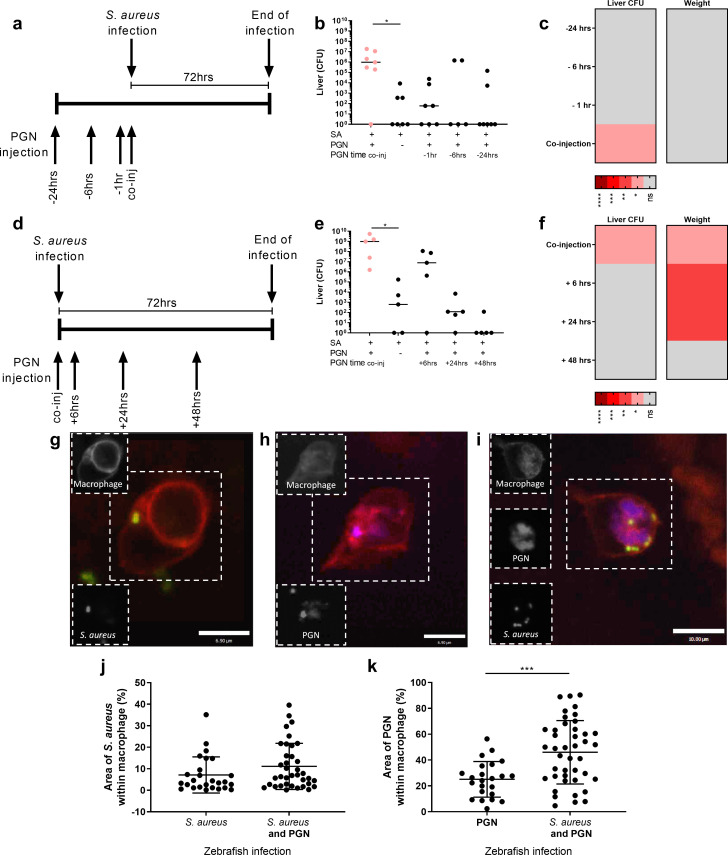
A-C Mice were intravenously injected with 500 μg M. luteus PGN 24 hours, 6 hours or 1 hour before infection with 1x10⁶ S. aureus, or at the same time as S. aureus, or with S. aureus alone A Diagram of experimental protocol B liver CFUs, enumerated at 72 hpi (n = 7 per group, median value shown, Kruskal-Wallis test with Dunn’s post-test), *p<0.05 C Summary heat-map for augmenting ability of PGN added before S. aureus infection, showing significant changes in liver CFUs and weight change D-F Mice were intravenously injected with 500 μg M. luteus PGN 48 hours, 24 hours or 6 hours after infection with 1x10⁶ S. aureus, or at the same time as S. aureus, or with S. aureus alone D Diagram of experimental protocol E liver CFUs, enumerated at 72 hpi (n = 5 per group, median value shown, Kruskal-Wallis test with Dunn’s post-test) *p<0.05 F Summary heat-map for augmenting ability of PGN added after S. aureus infection, showing significant changes in liver CFUs and weight change G-K Zebrafish larvae injected with 400 CFU S. aureus, 5 ng of M. luteus PGN, or both. The larvae have fluorescent macrophages (red) and were injected with fluorescent S. aureus (green) and/or fluorescently labelled M. luteus PGN (blue) G-I Images of infected larvae at 2 hpi showing macrophages containing S. aureus, scale 6.9 μm, greyscale insets depict location of fluorescence signal within the hatched box of the main image, for ease of visualisation (G), M. luteus peptidoglycan scale 6.9 μm (H), or both scale 10 μm (I), J Area of macrophage taken up by S. aureus at 2 hpi (n = 3, 14–21 larvae per group, unpaired t-test) K Area of macrophage taken up by M. luteus PGN at 2hpi (n = 3, 11–21 larvae per group, two-tailed unpaired t-test, ***p<0.0004).