
|
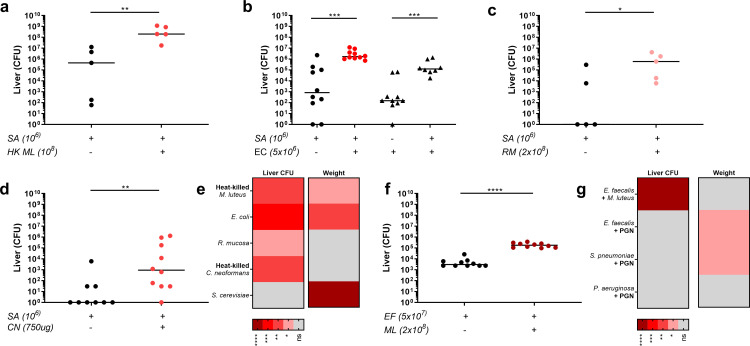
Fig 1
Co-injection of low dose S. aureus (SA 1x10⁶ CFU) with heat-killed M. luteus (HK ML equivalent of 1x10⁸ CFU) into mice: liver CFU (n = 5 per group, median value shown, two-tailed Mann-Whitney test), **p<0.008 B Co-injection of low dose S. aureus (SA 1x10⁶ CFU) with E. coli (EC 5x10⁶ CFU) into mice: liver CFU, S. aureus, circles; E. coli triangles (n = 8–10 per group, median value shown, two individual two-tailed Mann-Whitney tests), ***p<0.0003 C Co-injection of low dose S. aureus (SA 1x10⁶ CFU) with R. mucosa (RM 2x10⁸ CFU) into mice: liver CFU (n = 5 per group, median value shown, two-tailed Mann-Whitney test), *p<0.05 D Co-injection of low dose S. aureus (SA 1x10⁶ CFU) with heat-killed C. neoformans (CN 750 μg) into mice: liver CFU (n = 9–10 per group, median value shown, two-tailed Mann-Whitney test), **p<0.006 E Summary heat-map for microorganisms tested for augmenting ability in S. aureus infection, showing significant changes in liver CFUs and weight change F Co-injection of low dose E. faecalis (EF 5x10⁷ CFU) with M. luteus (ML 2x10⁸ CFU) into mice: liver CFU (n = 10 per group, median value shown, two-tailed Mann-Whitney test), ****p<0.0001 G Summary heat-map of alternative pathogens tested for ability to be augmented, with addition of PGN or M. luteus, showing significant changes in liver CFUs and weight change. In all cases liver CFUs were enumerated at 3 days post-infection.