A molecular toolkit for optical control of receptor activity and measurement of signaling outputs in the same cell.

a Like chemoattractant receptors (above), the light-activated parapinopsina (below) is a Giα-coupled receptor. The chemical structure above the parapinopsina receptor represents the retinal chromophore that facilitates photon detection and receptor activation. Ultraviolet light photo-isomerizes 9-cis-retinal to all trans-retinal, activating the receptor. Longer wavelengths inactivate the receptor and photo-isomerize the retinal chromophore back to the cis-conformation. b Schematic for the TomKat fluorescence resonance energy transfer (FRET) sensor that is spectrally compatible with parapinopsina. The FRET donor is td-Tomato, while td-Katushka2 is the FRET acceptor. The sensor contains the Cdc42 binding domain from PAK1 and a C-terminally truncated Cdc42 that are separated by a linker domain. The sensor C-terminus contains the K-Ras C-terminal polybasic region and CAAX motif, which anchor the sensor to the plasma membrane. c The spatial activity profiles were reported by TomKat and CFP/YFP FRET sensors in randomly moving differentiated PLB-985 cells. Data are presented as mean ± s.e.m. (n = 73 cells for TomKat sensor and n = 59 cells for CFP/YFP sensor). d Cdc42 activity responses to global optogenetic receptor activation are dependent on light stimulation and 9-cis-retinal cofactor. The response rapidly attenuates after stimulations cease, indicating that the receptor is inactivated by imaging with longer (>530 nm) wavelengths of light. Data are presented as mean ± s.e.m. (nwell replicates = 19 for Stim-Ret, nwell replicates = 31 for No Stim + Ret, and nwell replicates = 59 Stim + Ret). Relative light intensity = 10. Time on the x-axis is relative to the last FRET image before stimulation. e Focal stimulation of the optogenetic-GPCR can repolarize a cell and drive a chemotaxis response. The white arrowheads indicate the target region pre-stimulus, while the magenta circles indicate the stimulated region. The Cdc42-TomKat sensor can be used to measure subcellular Cdc42 activity in the optogenetic receptor-stimulated cells. Scale bar, 25 µm. Micrographs are representative of n = 141 cells. Source data are provided as a Source Data file.

Dose-dependent positive and negative signals downstream of receptors shape a graded Cdc42 response.

a Schematic of unknown signal processing between receptors and Cdc42. b Populations of differentiated PLB-985 cells expressing parapinopsina and the Cdc42-TomKat sensor were stimulated with a single light pulse of the indicated intensities. The mean FRET ratio was measured as a function of time. Stimulus duration is indicated by the gray bar. A minimum of seven-well replicates was performed for each condition (exact numbers listed in the “Methods”). See Supplementary Fig. 1a for the plot with error bars. Tens to hundreds of cells were imaged in each well. c Schematic for analysis of single-cell response amplitudes. For each cell, the response was broken into three, 6 s windows. The mean FRET ratio was calculated for each window (C1 = −13.5 to −7.5 s, C2 = −6 to 0 s, P = 4.5 to 10.5 s). d Histograms of single-cell response amplitudes to a single light-pulse stimulus of the indicated intensities. FRET ratio fold change was calculated by taking the ratio of the peak response (P) to the control window (C2). Total cell numbers of n = 4127 cells (relative light intensity = 0), n = 2317 cells (relative light intensity = 20), and n = 2261 cells (relative light intensity = 100) were analyzed from four independent experiments. Data are presented as mean ± s.e.m. (nexperiment = 4). Source data are provided as a Source Data file.

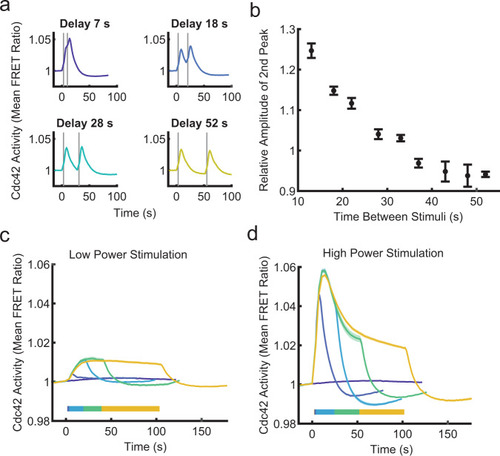
The Cdc42 circuit is regulated by complex, multi-level negative regulation.

a Cdc42 responses are shown for four different two-pulse stimulation protocols with the indicated delay times between stimulations. The relative light intensity was ten for all plots. Data are presented as mean (nwell replicates = 30 for 7 s, nwell replicates = 6 for 18 s, nwell replicates = 6 for 28 s, and nwell replicates = 4 for 52 s). See Supplementary Fig. 2 for all two-pulse stimulation plots. Stimulus duration indicated by gray bars. b Relative amplitude of the second Cdc42 response peak as a function of time between stimuli. The relative amplitude is calculated as the ratio of the second peak to the first peak. A time delay of 7 s was not included because a second peak could not be resolved from the first. Data are presented as mean ± s.e.m. (nwell replicates = 6 for 13 s, nwell replicates = 6 for 18 s, nwell replicates = 6 for 22 s, nwell replicates = 6 for 28 s, nwell replicates = 26 for 33 s, nwell replicates = 4 for 37 s, nwell replicates = 4 for 43 s, nwell replicates = 4 for 48 s, and nwell replicates = 4 for 52 s). c, d Repeated global stimulations were applied to simulate continuous receptor stimulation. Stimulation duration is indicated by horizontal color bars. Data are presented as mean ± s.e.m. c Cdc42 response to the indicated stimulus durations with low-power stimulation (relative light intensity = 1). nwell replicates = 65 for non-stimulated, nwell replicates = 21 for 1 stimulation, nwell replicates = 20 for 7 stimulations, nwell replicates = 21 for 15 stimulations, and nwell replicates = 27 for 30 stimulations. d Cdc42 response to the indicated stimulus durations with high-power stimulation (relative light intensity = 100). nwell replicates = 65 for 0 stimulation condition, nwell replicates = 12 for 1 stimulation, nwell replicates = 12 for 7 stimulations, nwell replicates = 12 for 15 stimulations, and nwell replicates = 77 for 30 stimulations. Source data are provided as a Source Data file.

Genetic knockout of <italic>CDC42</italic> reveals a central role in organizing and maintaining cell polarity.

a Western blot comparing the CDC42-knockout (Cdc42-KO) and control cell lines stained for β-actin and Cdc42. Blot is representative of n = 3 experiments. b The mean-squared displacement (MSD) was measured as a function of time for control and Cdc42-KO cells randomly migrating. Data are presented as mean ± s.e.m. (nexperiment = 4). A total of 10,687 control cells and 3018 Cdc42-KO cells were analyzed across the four experiments. c As a measure of directional persistence, the mean cosine of the angle between a migrating cell’s movement direction at two different time points was measured as a function of the difference in time between the two measurements. Cells migrating in a straight line would have a mean cosine angle of 1. Data are presented as mean ± s.e.m. (nexperiment = 4). A total of 4821 control cells and 1098 Cdc42-KO cells were analyzed across the four experiments. d Fraction of cells exhibiting the cytoplasmic tether phenotype. Data are presented as mean ± s.e.m. (nexperiment = 4). A total of 331 control cells and 194 Cdc42-KO cells were analyzed across the four experiments. *P = 0.0108 using two-sided t test with unequal variances. Scattered points represent relative frequency for each experimental replicate. e Time-lapse image series of control cells randomly migrating. Control cells tend to maintain one cell front at a time and migrate more persistently. Scale bar, 15 µm. Micrographs are representative of n = 331 cells. Grayscale bars indicate fluorescence intensity. f, g Time-lapse image series of Cdc42-KO cells randomly migrating. Micrographs are representative of n = 194 cells. Scale bar, 15 µm. Grayscale bars indicate fluorescence intensity. f This cell displays a range of phenotypes, including a very large, crescent-shaped leading edge in the first time point and multiple repolarization events thereafter. g This cell displays the cytoplasmic tether phenotype where the leading edge pulls away from the cell body, but remains linked by a thin cytoplasmic filament. Source data are provided as a Source Data file.

Cdc42 is activated downstream of G<sub>i</sub>α family G proteins.

a Schematic indicating the potential for Cdc42 response regulation independent of heterotrimeric G protein signals. b, c Single-pulse stimulations of populations of PLB-985 cells expressing parapinopsina and the Cdc42-TomKat sensor either without (b) or after treatment with 600 ng/ml Pertussis toxin (PTX) to inhibit Giα-dependent signals (c). b Data are presented as mean ± s.e.m of nwell replicates = 16 for all conditions. c Data are presented as mean ± s.e.m (nwell replicates = 27 for relative light intensity = 0, nwell replicates = 25 for relative light intensity = 5, nwell replicates = 26 for relative light intensity = 10, nwell replicates = 16 for relative light intensity = 20, and nwell replicates = 16 for relative light intensity = 50). Stimulus duration is indicated by the gray bar. Source data are provided as a Source Data file.

Multiple negative signals downstream of G proteins collaborate to regulate the Cdc42 response.

a Comparison of Cdc42 responses to prolonged stimulation with or without treatment with 5 μM PAK1 inhibitor IPA-3. Data are presented as mean ± s.e.m. (nwell replicates = 65 for non-stimulated, nwell replicates = 77 for control, and nwell replicates = 32 for PAK1 inhibited). Relative light intensity = 100. Stimulation duration is indicated by color bars. b Comparison of Cdc42-TomKat sensor response measurements under the same conditions for Cdc42-KO cells and control cells. Data are presented as mean ± s.e.m. (nwell replicates 65 for non-stimulated, nwell replicates = 77 for control, and nwell replicates = 56 for Cdc42-KO). Relative light intensity = 100. Stimulation duration is indicated by color bars. c Comparison of the responses of the same cell lines to lower power stimulations. Data are presented as mean ± s.e.m. (nwell replicates = 65 for non-stimulated, nwell replicates = 27 for control, and nwell replicates = 16 for Cdc42-KO). Relative light intensity = 1. Stimulation duration is indicated by color bars. d Comparison of Cdc42 responses to prolonged stimulation with or without treatment with 1 μM of the actin-depolymerizing agent Latrunculin-A (LatA). Data are presented as mean ± s.e.m. (nwell replicates = 65 for non-stimulated, nwell replicates = 77 for control, and nwell replicates = 25 for Latrunculin-A-treated cells). Relative light intensity = 100. Stimulation duration is indicated by color bars. e Comparison of single-pulse stimulation responses for control cells, Cdc42-KO cells, and 1 μM Latrunculin-A cells. Data are presented as mean ± s.e.m. (nwell replicates = 76 for control, nwell replicates = 42 for Cdc42-KO, and nwell replicates = 70 for Latrunculin-A-treated cells). Relative light intensity = 50. Stimulus duration indicated by gray bar. f Comparison of responses for untreated control cells and Cdc42-KO cells treated with 1 μM Latrunculin-A. Data are presented as mean ± s.e.m. (nwell replicates = 65 for non-stimulated, nwell replicates = 77 for control, and nwell replicates = 32 for Latrunculin-A + Cdc42-KO cells). Relative light intensity = 100. Stimulation duration is indicated by color bars. Source data are provided as a Source Data file.

F-actin and Cdc42 spatially constrain the spread of signals downstream of receptors.

a A control cell responding to the center-stimulation experiment. A single laser pulse (4.3 µW, 10 ms duration) was applied between frames 1 and 2. The purple circle indicates the stimulation site. Top panel images are the sum of the two FRET channels. Bottom panel images are FRET ratio images. Times relative to stimulation are indicated. Scale bar, 15 µm. Micrographs are representative of n = 131 cells. b The spatial Cdc42 response was calculated as fold change between the FRET ratio images before and after stimulation (Frame 3/Frame 1) for the cell shown in (a). Scale bar, 15 µm. The image is representative of n = 131 cells. c Schematic for center-stimulation experiment analysis strategy. Cell pixels were aggregated based on their distance from the stimulus target site (magenta circle) for each frame in the experiment. d Relative Cdc42 response as a function of distance from the stimulus target site for control cells at the indicated time points. One 0.8 µW light pulse of 10 ms duration was delivered at t = 0 s. Data are presented as mean ± s.e.m. (n = 181 cells). e, f Relative Cdc42 response as a function of distance from stimulus target site for control, Cdc42-KO, and Latrunculin-A conditions at t = 0.8 s (e) and t = 3.8 s (f) post stimulation. Data are presented as mean ± s.e.m. (n = 181 cells for control, n = 67 for Cdc42-KO, and n = 175 for Latrunculin-A-treated cells). g, h Relative Cdc42 responses as a function of distance from the stimulation site for control and Latrunculin-A conditions in response to five sequential 0.8 µW light-pulses of 10 ms duration delivered immediately after successive images, with the first stimulus delivered at t = 0 s. Data are presented as mean ± s.e.m. (n = 142 cells for control and n = 102 for Latrunculin-A-treated cells). i Schematic indicating the positive and negative regulators of the Cdc42 response identified in this study. Source data are provided as a Source Data file.

Acknowledgments
This image is the copyrighted work of the attributed author or publisher, and ZFIN has permission only to display this image to its users. Additional permissions should be obtained from the applicable author or publisher of the image. Full text @ Nat. Commun.