IMAGE

Fig. 4

ID
ZDB-IMAGE-211122-18
Source
Figures for Bell et al., 2021
Image
Figure Caption

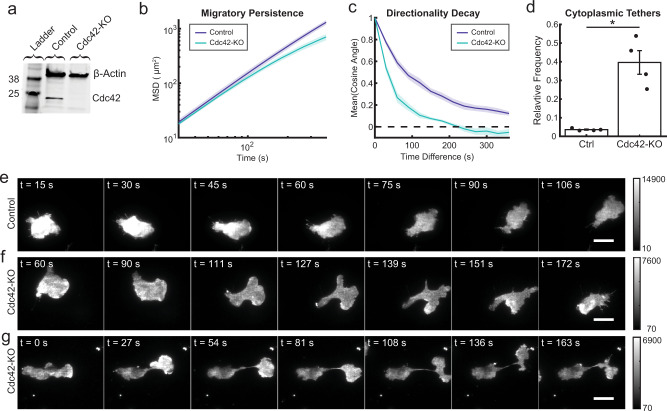
Fig. 4 Genetic knockout of <italic>CDC42</italic> reveals a central role in organizing and maintaining cell polarity.

a Western blot comparing the CDC42-knockout (Cdc42-KO) and control cell lines stained for β-actin and Cdc42. Blot is representative of n = 3 experiments. b The mean-squared displacement (MSD) was measured as a function of time for control and Cdc42-KO cells randomly migrating. Data are presented as mean ± s.e.m. (nexperiment = 4). A total of 10,687 control cells and 3018 Cdc42-KO cells were analyzed across the four experiments. c As a measure of directional persistence, the mean cosine of the angle between a migrating cell’s movement direction at two different time points was measured as a function of the difference in time between the two measurements. Cells migrating in a straight line would have a mean cosine angle of 1. Data are presented as mean ± s.e.m. (nexperiment = 4). A total of 4821 control cells and 1098 Cdc42-KO cells were analyzed across the four experiments. d Fraction of cells exhibiting the cytoplasmic tether phenotype. Data are presented as mean ± s.e.m. (nexperiment = 4). A total of 331 control cells and 194 Cdc42-KO cells were analyzed across the four experiments. *P = 0.0108 using two-sided t test with unequal variances. Scattered points represent relative frequency for each experimental replicate. e Time-lapse image series of control cells randomly migrating. Control cells tend to maintain one cell front at a time and migrate more persistently. Scale bar, 15 µm. Micrographs are representative of n = 331 cells. Grayscale bars indicate fluorescence intensity. f, g Time-lapse image series of Cdc42-KO cells randomly migrating. Micrographs are representative of n = 194 cells. Scale bar, 15 µm. Grayscale bars indicate fluorescence intensity. f This cell displays a range of phenotypes, including a very large, crescent-shaped leading edge in the first time point and multiple repolarization events thereafter. g This cell displays the cytoplasmic tether phenotype where the leading edge pulls away from the cell body, but remains linked by a thin cytoplasmic filament. Source data are provided as a Source Data file.

Acknowledgments
This image is the copyrighted work of the attributed author or publisher, and ZFIN has permission only to display this image to its users. Additional permissions should be obtained from the applicable author or publisher of the image. Full text @ Nat. Commun.