|
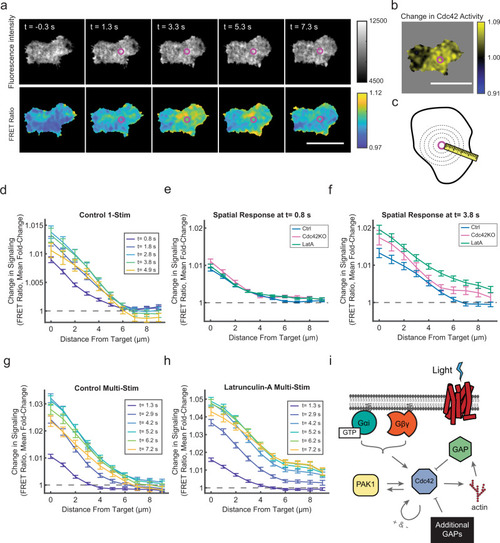
F-actin and Cdc42 spatially constrain the spread of signals downstream of receptors.a A control cell responding to the center-stimulation experiment. A single laser pulse (4.3 µW, 10 ms duration) was applied between frames 1 and 2. The purple circle indicates the stimulation site. Top panel images are the sum of the two FRET channels. Bottom panel images are FRET ratio images. Times relative to stimulation are indicated. Scale bar, 15 µm. Micrographs are representative of n = 131 cells. b The spatial Cdc42 response was calculated as fold change between the FRET ratio images before and after stimulation (Frame 3/Frame 1) for the cell shown in (a). Scale bar, 15 µm. The image is representative of n = 131 cells. c Schematic for center-stimulation experiment analysis strategy. Cell pixels were aggregated based on their distance from the stimulus target site (magenta circle) for each frame in the experiment. d Relative Cdc42 response as a function of distance from the stimulus target site for control cells at the indicated time points. One 0.8 µW light pulse of 10 ms duration was delivered at t = 0 s. Data are presented as mean ± s.e.m. (n = 181 cells). e, f Relative Cdc42 response as a function of distance from stimulus target site for control, Cdc42-KO, and Latrunculin-A conditions at t = 0.8 s (e) and t = 3.8 s (f) post stimulation. Data are presented as mean ± s.e.m. (n = 181 cells for control, n = 67 for Cdc42-KO, and n = 175 for Latrunculin-A-treated cells). g, h Relative Cdc42 responses as a function of distance from the stimulation site for control and Latrunculin-A conditions in response to five sequential 0.8 µW light-pulses of 10 ms duration delivered immediately after successive images, with the first stimulus delivered at t = 0 s. Data are presented as mean ± s.e.m. (n = 142 cells for control and n = 102 for Latrunculin-A-treated cells). i Schematic indicating the positive and negative regulators of the Cdc42 response identified in this study. Source data are provided as a Source Data file.
|