|
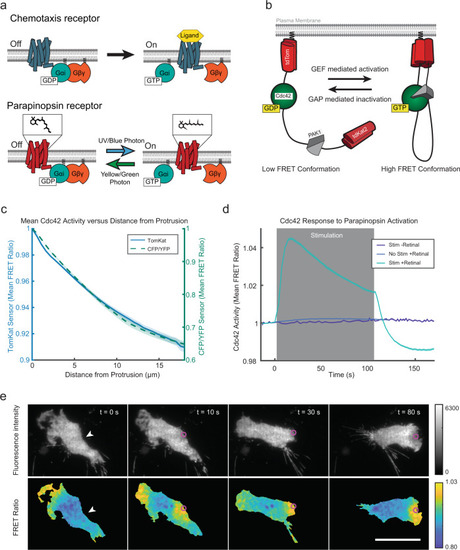
A molecular toolkit for optical control of receptor activity and measurement of signaling outputs in the same cell.a Like chemoattractant receptors (above), the light-activated parapinopsina (below) is a Giα-coupled receptor. The chemical structure above the parapinopsina receptor represents the retinal chromophore that facilitates photon detection and receptor activation. Ultraviolet light photo-isomerizes 9-cis-retinal to all trans-retinal, activating the receptor. Longer wavelengths inactivate the receptor and photo-isomerize the retinal chromophore back to the cis-conformation. b Schematic for the TomKat fluorescence resonance energy transfer (FRET) sensor that is spectrally compatible with parapinopsina. The FRET donor is td-Tomato, while td-Katushka2 is the FRET acceptor. The sensor contains the Cdc42 binding domain from PAK1 and a C-terminally truncated Cdc42 that are separated by a linker domain. The sensor C-terminus contains the K-Ras C-terminal polybasic region and CAAX motif, which anchor the sensor to the plasma membrane. c The spatial activity profiles were reported by TomKat and CFP/YFP FRET sensors in randomly moving differentiated PLB-985 cells. Data are presented as mean ± s.e.m. (n = 73 cells for TomKat sensor and n = 59 cells for CFP/YFP sensor). d Cdc42 activity responses to global optogenetic receptor activation are dependent on light stimulation and 9-cis-retinal cofactor. The response rapidly attenuates after stimulations cease, indicating that the receptor is inactivated by imaging with longer (>530 nm) wavelengths of light. Data are presented as mean ± s.e.m. (nwell replicates = 19 for Stim-Ret, nwell replicates = 31 for No Stim + Ret, and nwell replicates = 59 Stim + Ret). Relative light intensity = 10. Time on the x-axis is relative to the last FRET image before stimulation. e Focal stimulation of the optogenetic-GPCR can repolarize a cell and drive a chemotaxis response. The white arrowheads indicate the target region pre-stimulus, while the magenta circles indicate the stimulated region. The Cdc42-TomKat sensor can be used to measure subcellular Cdc42 activity in the optogenetic receptor-stimulated cells. Scale bar, 25 µm. Micrographs are representative of n = 141 cells. Source data are provided as a Source Data file.
|