|
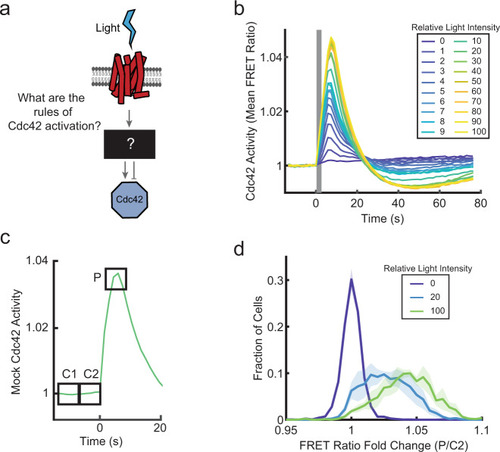
Dose-dependent positive and negative signals downstream of receptors shape a graded Cdc42 response.a Schematic of unknown signal processing between receptors and Cdc42. b Populations of differentiated PLB-985 cells expressing parapinopsina and the Cdc42-TomKat sensor were stimulated with a single light pulse of the indicated intensities. The mean FRET ratio was measured as a function of time. Stimulus duration is indicated by the gray bar. A minimum of seven-well replicates was performed for each condition (exact numbers listed in the “Methods”). See Supplementary Fig. 1a for the plot with error bars. Tens to hundreds of cells were imaged in each well. c Schematic for analysis of single-cell response amplitudes. For each cell, the response was broken into three, 6 s windows. The mean FRET ratio was calculated for each window (C1 = −13.5 to −7.5 s, C2 = −6 to 0 s, P = 4.5 to 10.5 s). d Histograms of single-cell response amplitudes to a single light-pulse stimulus of the indicated intensities. FRET ratio fold change was calculated by taking the ratio of the peak response (P) to the control window (C2). Total cell numbers of n = 4127 cells (relative light intensity = 0), n = 2317 cells (relative light intensity = 20), and n = 2261 cells (relative light intensity = 100) were analyzed from four independent experiments. Data are presented as mean ± s.e.m. (nexperiment = 4). Source data are provided as a Source Data file.
|