|
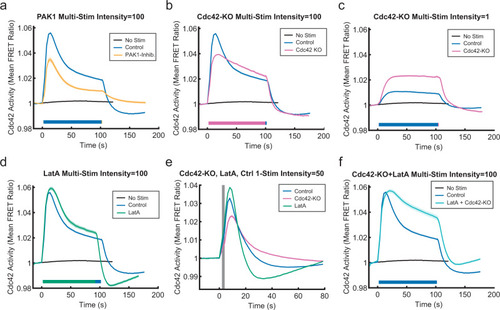
Multiple negative signals downstream of G proteins collaborate to regulate the Cdc42 response.a Comparison of Cdc42 responses to prolonged stimulation with or without treatment with 5 μM PAK1 inhibitor IPA-3. Data are presented as mean ± s.e.m. (nwell replicates = 65 for non-stimulated, nwell replicates = 77 for control, and nwell replicates = 32 for PAK1 inhibited). Relative light intensity = 100. Stimulation duration is indicated by color bars. b Comparison of Cdc42-TomKat sensor response measurements under the same conditions for Cdc42-KO cells and control cells. Data are presented as mean ± s.e.m. (nwell replicates 65 for non-stimulated, nwell replicates = 77 for control, and nwell replicates = 56 for Cdc42-KO). Relative light intensity = 100. Stimulation duration is indicated by color bars. c Comparison of the responses of the same cell lines to lower power stimulations. Data are presented as mean ± s.e.m. (nwell replicates = 65 for non-stimulated, nwell replicates = 27 for control, and nwell replicates = 16 for Cdc42-KO). Relative light intensity = 1. Stimulation duration is indicated by color bars. d Comparison of Cdc42 responses to prolonged stimulation with or without treatment with 1 μM of the actin-depolymerizing agent Latrunculin-A (LatA). Data are presented as mean ± s.e.m. (nwell replicates = 65 for non-stimulated, nwell replicates = 77 for control, and nwell replicates = 25 for Latrunculin-A-treated cells). Relative light intensity = 100. Stimulation duration is indicated by color bars. e Comparison of single-pulse stimulation responses for control cells, Cdc42-KO cells, and 1 μM Latrunculin-A cells. Data are presented as mean ± s.e.m. (nwell replicates = 76 for control, nwell replicates = 42 for Cdc42-KO, and nwell replicates = 70 for Latrunculin-A-treated cells). Relative light intensity = 50. Stimulus duration indicated by gray bar. f Comparison of responses for untreated control cells and Cdc42-KO cells treated with 1 μM Latrunculin-A. Data are presented as mean ± s.e.m. (nwell replicates = 65 for non-stimulated, nwell replicates = 77 for control, and nwell replicates = 32 for Latrunculin-A + Cdc42-KO cells). Relative light intensity = 100. Stimulation duration is indicated by color bars. Source data are provided as a Source Data file.
|