FIGURE SUMMARY
Title

NRG1/ErbB signalling controls the dialogue between macrophages and neural crest-derived cells during zebrafish fin regeneration

Authors
Laplace-Builhé, B., Barthelaix, A., Assou, S., Bohaud, C., Pratlong, M., Severac, D., Tejedor, G., Luz-Crawford, P., Nguyen-Chi, M., Mathieu, M., Jorgensen, C., Djouad, F.
Source
Full text @ Nat. Commun.

Characterization of cells in the zebrafish blastema by scRNA-seq.

a scRNA-seq experiment design. b Uniform Manifold Approximation and Projection (UMAP) plots visualizing RNA-sequencing data of single cells from the cut caudal fin fold. Seven different cell clusters were identified c Heatmap displaying the genes that are differentially expressed in the seven clusters. Red, upregulated genes, and blue, downregulated genes. d UMAP representation of the expression (low to high, grey to red) of cell markers in the different clusters. eFoxd3, sox10, and egr2b expression in cluster 7 (low to high expression, grey to blue). f Heatmap of the gene expression profile of the foxd3+, sox10+, and egr2b+cell populations.

<italic>Foxd3</italic><sup>+</sup>NCdC in the developing and regenerating caudal fin fold mesenchyme are located next to proliferative <italic>rcn3</italic><sup>+</sup> mesenchymal cells.

a Confocal images of Tg(foxd3:eGFP-F) zebrafish embryos at 11 somites and 14 somites (Scale bars = 300 µm). b, c Representative fluorescent images of Tg(foxd3:eGFP-F) 3 dpf larvae (Scale bar = 400 µm. (b) scale bar = 80 µm (c) d Schematic representation of caudal fin fold regeneration after amputation of 3 dpf larvae. e Representative confocal microscopy images of Tg(foxd3:eGFP-F/rcn3:Gal4/UAS:mCherry) larvae during regeneration (Scale bars = 80 µm, representative from 5 biologically independent larvae examined over 3 independent experiments). f Schematic representation of the fluorescent-activated flow cytometry analysis of eGFP+ and mCherry+ cells from caudal fin fold of Tg(foxd3:eGFP-F/rcn3:Gal4/UAS:mCherry) larvae at 6 and 24 hpA. Data were analysed using FlowJo v10. g Frequency of mCherry+ cell number in the caudal fin fold at 6 and 24 hpA relative to the age-matched uninjured controls. h Frequency of eGFP+ cell number in the caudal fin fold at 6 and 24 hpA relative to the age-matched uninjured controls (fold change). i Frequency of mCherry+eGFP+ cell number in the caudal fin fold at 6 and 24 hpA relative to the age-matched uninjured controls. gi Graphs represent the mean value ± SEM, one-tailed Wilcoxon test was performed, *p < 0.05, p = 0.05 (g), p = 0,0143 (i), n = 50300 larvae per group from 5 independent experiments.

<italic>Foxd3</italic><sup><italic>+</italic></sup> NCdC are required for blastemal cell proliferation and zebrafish caudal fin fold regeneration.

a Quantification of cell proliferation in the blastema of Tg(rcn3:Gal4/UAS:mCherry) larvae from 6hpA to 72 hpA. Mitotic cells were detected using an anti-PH3 antibody. Data are shown as fold change relative to the age-matched uninjured controls, and are the mean ± SEM, n = 8 (for the 6, 24, 72 hpA time points), n = 12 (for the 48 hpA time point), **p < 0.01. b Image of a time-lapse z-stack sequence of a Tg(foxd3:eGFP-F/rcn3:Gal4/UAS:mCherry) larvae at 24 hpA with x and y projections using the Fiji software (Scale bar = 8 µm). c Confocal images of caudal fin fold of Tg(foxd3:eGFP-F/rcn3:Gal4/UAS:mCherry) larvae injected with MOctl or MOfoxd3 at 3 dpf, and then from 6 hpA to 72 hpA (asterisks show pigments, scale bars = 80 µm, representative of n = 5 larvae from 3 independent experiments). d Blastemal cell proliferation in foxd3 and control morphants was assessed using an anti-PH3 antibody at 24 hpA. Data are shown as fold change relative to the age-matched uninjured controls, and error bars are the SEM, n = 6 (for the control group) and n = 16 (for the foxd3 morphants) biologically independent larvae, one-tailed MannWhitney test was performed, p = 0.0007, ***p < 0.001. e Quantification of caudal fin fold length in foxd3 and control morphants at 72hpA. Error bars are the SEM, n = 21 biologically independent larvae, one-tailed Mann-Whitney test was performed, p = 0.0002, ***p < 0.001. f The mRNA expression of the blastemal marker junb-l (blue) was detected by in situ hybridization at 24 hpA in control and amputated fin folds from 4 dpf wild type (WT) and Tg(foxd3:mCherry)ct110 (ct110) mutant larvae (representative of n = 15 biologically independent larvae per groups). g Blastemal cell proliferation in heterozygotes (WT) and homozygotes (ct110) Tg(foxd3:mCherry)ct110 larvae at 24 hpA was detected using an anti-PH3 antibody (graph represents the mean number of positive cells ± SEM, n = 21 (for the WT groups) and n = 18 (for mutants) larvae from 3 independent experiments, one-tailed Mann-Whitney test was performed, p = 0.0002, ***p < 0.001). (h) Quantification of fin fold growth at 72hpA in WT and Tg(foxd3:mCherry)ct110 mutant 6 dpf larvae (graph represents the mean ± SEM, n = 22 (for the WT group), n = 19 (for the mutant group) biologically independent larvae, one-tailed Mann Whitney test was performed, p = 0.0001, ***p < 0.001).

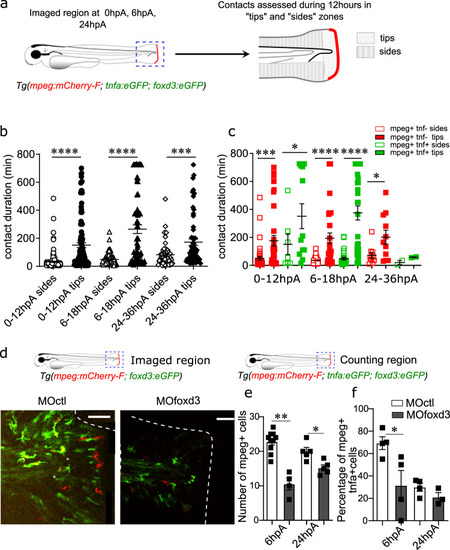
<italic>Foxd3</italic><sup><italic>+</italic></sup> NCdC interact with and promote the recruitment and activation of macrophages in the blastema.

a Schematic representation of the tip and sides where macrophages and foxd3+ NCdC contacts were assessed for 12 h by live confocal microscopy at 0hpA, 6 hpA, 24 hpA in Tg(mpeg:mCherry-F; tnfa:eGFP-F; foxd3:eGFP-F) larvae. b Quantification of the duration of macrophages and foxd3+NCdC contacts in the tips and sides during 12 h in Tg(mpeg:mCherry-F; tnfa:eGFP-F; foxd3:eGFP-F) larvae, at 0hpA (n = 192 for the sides group, n = 124 for the tips group), 6 hpA (n = 105 for the sides group, n = 71 for the tips group), and 24 hpA (n = 54 for the sides group, n = 60 for the tips group) (mean number of contact durations ± SEM, from at least n = 5 biologically independent larvae per time points, Kruskal Wallis test with Dunn’s test for multiple comparison were performed, ****p < 0.0001,). c Quantification of the contact duration between macrophages (mpeg + and tnfa+) and foxd3+ cells in tips and sides during 12 h in the transgenic larvae, at 0 hpA, 6 hpA, 24 hpA (mean number of contact durations ± SEM, Kruskal-Wallis test and Dunn’s test for multiple comparison were performed, *p < 0.05, ***p < 0.001, ****p < 0.0001, n = 3 biologically independent larvae per time point). d Fluorescence microscopy images of 3 dpf Tg(mpeg1:mCherry-F/tnfa:eGFP-F/foxd3:eGFP-F) larvae injected with MOctl or MOfoxd3 (Scales bars = 50 µm). e Number of macrophages recruited at the wound site at 6 hpA and 24 hpA in MOctl- and MOfoxd3-injected Tg(mpeg1:mCherry-F) larvae (graph represents mean number of positive cells ± SEM, n = 10 biologically independent larvae for the control group at 6 hpA, n = 4 larvae for the MOfoxd3 group at 6 hpA, n = 5 larvae for both control and morphant group at 24hpA, one-tailed Mann-Whitney test was performed, p = 0.0028 for the 6 hpA time point, p = 0.0106 for the 24 hpA time point, *p < 0.05, **p < 0.01). f Percentage of pro-inflammatory macrophages at the wound site at 6 hpA and 24 hpA (graph represents mean number of mpeg+tnfa+ cells ± SEM, n = 4 biologically independent larvae per groups, one−tailed Mann-Whitney test was performed, p = 0.0286 for the 6 hpA time point, *p < 0.05).

Nrg1 and ErbB family members are expressed in blastemal cells and are required for appendage regeneration.

a Representative image of nrg1 mRNA expression in uncut caudal fin fold and at 24hpA (from n = 15 biologically independent larvae). b Wild type 3dpf larvae were amputated or not and exposed to DMSO, AG1478, or PD168393 for 72 h. Cell proliferation and fin fold growth were measured at 24hpA and 72hpA, respectively. c Quantification of cell proliferation in 24 hpA larvae after the indicated treatments (graph represents means ± SEM, n = 17 larvae for DMSO group, n = 4 larvae for PD168393 group, n = 9 larvae for AG1478 group, Kruskal-Wallis test and Dunn’s test for multiple comparisons were performed, **p < 0.01, ***p < 0.001). d Quantification of fin fold growth in 72 hpA wild type larvae after the indicated treatments (error bars show the SEM, n = 15 larvae for DMSO group, n = 10 larvae for PD168393 group, n = 5 larvae for AG1478 group, Kruskal-Wallis test and Dunn’s test for multiple comparisons were performed **p < 0.01, ***p < 0.001). enrg1 expression by in situ hybridization analysis in intact caudal fin folds and at 24hpA of MOfoxd3 or MOctl larvae (from n = 15 biologically independent larvae). f Relative expression of nrg1.004, and gerbb2 mRNA in wild type (WT) and Tg(foxd3:mCherry)ct110 mutant (ct110) larvae at 24hpA was assessed by RT-PCR using ef1a as reference gene (data are the mean ± SEM, n = 15 larvae per groups from 3 independent experiments, one-tailed MannWhitney test was performed, fp = 0.0286, gp = 0.05, *p < 0.05). h 3dpf Tg(mpeg1:mCherry-F/tnfa:eGFP-F) larvae were amputated or not and exposed to DMSO or AG1478. Macrophage recruitment was analysed at 6 hpA and 24 hpA. i Macrophage recruitment at the wound site in AG1478 or DMSO-treated Tg(mpeg1:mCherry-F) larvae at 6 hpA and 24 hpA (graph represents mean number of mCherry-positive cells ± SEM, n = 13 at 6 hpA and n = 24 at 24hpA for DMSO treated groups, n = 19 at 6 hpA and n = 22 at 24 hpA for AG1478 treated groups, one-tailed MannWhitney test was performed, p = 0.0154 for the 6 hpA time point, p = 0.0143 for the 24 hpA time point, *p < 0.05). j Macrophage polarization at the wound site in AG1478 or DMSO-treated Tg(mpeg1:mCherry-F/tnfa:eGFP-F) larvae at 6 hpA and 24 hpA (graph represents mean number of mCherry+ eGFP+ cells ± SEM, n = 7 at 6 hpA and n = 10 at 24 hpA for DMSO treated groups, n = 11 at 6 hpA and n = 12 at 24 hpA for AG1478 treated groups, one-tailed MannWhitney test was performed, p = 0.0003 for the 6 hpA time point, ***p < 0.001).

<italic>Erbb2</italic> is expressed by all blastemal cells including macrophages, and particularly pro-inflammatory macrophages.

aTg(mpeg1:mCherry-F/tnfa:eGFP-F) larvae were amputated or not (control) at 3 dpf, and cells were dissociated at 6 or 24 hpA and sorted by FACS. Red, green, and black gates represent mCherry+, mCherry+eGFP+, and mCherryeGFPcell populations, respectively. Relative expression of b, enrg1, c, ferbb2, and d, gerbb3 in mCherryeGFP, mCherry+ and mCherry+eGFP+ cells at 6 hpA b, c, d and 24 hpA e, f, g was quantified by RT-PCR on separated cells using ef1a as reference gene. b, c, d Graphs represent the mean value ± SEM, n = 200-300 pooled larvae from 4 independent experiments; one-tailed Mann-Whitney test was performed, p = 0.0286, *p < 0.05. e, f, g Graphs represent the mean value ± SEM, n = 200–300 pooled larvae from 6 independent experiments; one-tailed Mann-Whitney test was performed, ep = 0.0143, fp = 0.0465, *p < 0.05.

Acknowledgments
This image is the copyrighted work of the attributed author or publisher, and ZFIN has permission only to display this image to its users. Additional permissions should be obtained from the applicable author or publisher of the image. Full text @ Nat. Commun.