|
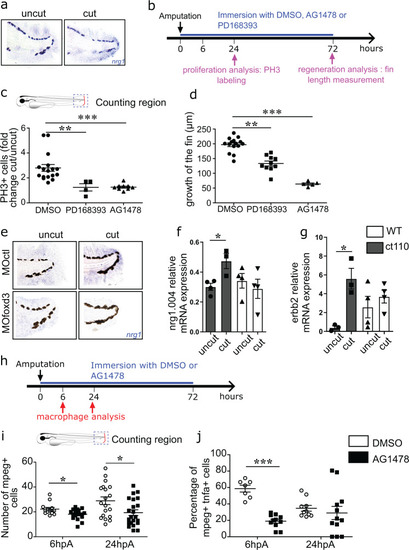
Nrg1 and ErbB family members are expressed in blastemal cells and are required for appendage regeneration.a Representative image of nrg1 mRNA expression in uncut caudal fin fold and at 24hpA (from n = 15 biologically independent larvae). b Wild type 3dpf larvae were amputated or not and exposed to DMSO, AG1478, or PD168393 for 72 h. Cell proliferation and fin fold growth were measured at 24hpA and 72hpA, respectively. c Quantification of cell proliferation in 24 hpA larvae after the indicated treatments (graph represents means ± SEM, n = 17 larvae for DMSO group, n = 4 larvae for PD168393 group, n = 9 larvae for AG1478 group, Kruskal-Wallis test and Dunn’s test for multiple comparisons were performed, **p < 0.01, ***p < 0.001). d Quantification of fin fold growth in 72 hpA wild type larvae after the indicated treatments (error bars show the SEM, n = 15 larvae for DMSO group, n = 10 larvae for PD168393 group, n = 5 larvae for AG1478 group, Kruskal-Wallis test and Dunn’s test for multiple comparisons were performed **p < 0.01, ***p < 0.001). enrg1 expression by in situ hybridization analysis in intact caudal fin folds and at 24hpA of MOfoxd3 or MOctl larvae (from n = 15 biologically independent larvae). f Relative expression of nrg1.004, and gerbb2 mRNA in wild type (WT) and Tg(foxd3:mCherry)ct110 mutant (ct110) larvae at 24hpA was assessed by RT-PCR using ef1a as reference gene (data are the mean ± SEM, n = 15 larvae per groups from 3 independent experiments, one-tailed Mann–Whitney test was performed, fp = 0.0286, gp = 0.05, *p < 0.05). h 3dpf Tg(mpeg1:mCherry-F/tnfa:eGFP-F) larvae were amputated or not and exposed to DMSO or AG1478. Macrophage recruitment was analysed at 6 hpA and 24 hpA. i Macrophage recruitment at the wound site in AG1478 or DMSO-treated Tg(mpeg1:mCherry-F) larvae at 6 hpA and 24 hpA (graph represents mean number of mCherry-positive cells ± SEM, n = 13 at 6 hpA and n = 24 at 24hpA for DMSO treated groups, n = 19 at 6 hpA and n = 22 at 24 hpA for AG1478 treated groups, one-tailed Mann–Whitney test was performed, p = 0.0154 for the 6 hpA time point, p = 0.0143 for the 24 hpA time point, *p < 0.05). j Macrophage polarization at the wound site in AG1478 or DMSO-treated Tg(mpeg1:mCherry-F/tnfa:eGFP-F) larvae at 6 hpA and 24 hpA (graph represents mean number of mCherry+ eGFP+ cells ± SEM, n = 7 at 6 hpA and n = 10 at 24 hpA for DMSO treated groups, n = 11 at 6 hpA and n = 12 at 24 hpA for AG1478 treated groups, one-tailed Mann–Whitney test was performed, p = 0.0003 for the 6 hpA time point, ***p < 0.001).
|