
- Title
-
Histone deacetylase 1 controls cardiomyocyte proliferation during embryonic heart development and cardiac regeneration in zebrafish
- Authors
- Bühler, A., Gahr, B.M., Park, D.D., Bertozzi, A., Boos, A., Dalvoy, M., Pott, A., Oswald, F., Kovall, R.A., Kühn, B., Weidinger, G., Rottbauer, W., Just, S.
- Source
- Full text @ PLoS Genet.
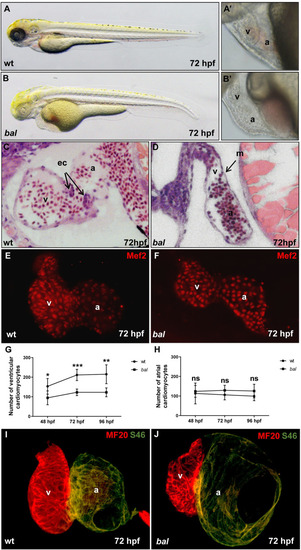
The baldrian mutation interferes with embryonic cardiomyocyte proliferation in zebrafish.
(A-B) Lateral view of 72 hpf wild-type sibling (wt) (A) and bal embryo (B). (A’, B’) Close-up of the heart region of wt (A’) and bal mutants (B’) displayed small ventricle of bal mutants. (C, D) Histological sections showed normal morphology of the wt heart (C) and a monolayered myocardium and small ventricle in the bal mutant heart. M, myocardium; ec, endocardial cushions; v, ventricle; a, atrium. (E, F) Embryonic zebrafish hearts stained with antibodies against MEF-2 to visualize cardiomyocyte nuclei. Cardiomyocyte (CM) numbers appear reduced in bal mutants compared to wild-type siblings. (G) Ventricular cardiomyocyte numbers at 48, 72 and 96 hpf, were significantly decreased in bal (48 hpf wt: 153.37 ± 39.91, n = 7 and bal: 94.71± 35.22, n = 8, p = 0.014; 72 hpf wt: 211.42 ± 28.81, n = 7 and bal: 122.85 ± 16.88, n = 7, p = 0.001; 96 hpf wt: 215.20 ± 48.35, n = 10 and bal 122.83 ± 22.83, n = 6, p = 0.001). Error bars indicate s.d., *p < 0.05, **p < 0.01, ***p < 0.001, ns, not significant. (H) Atrial CM numbers were unaltered (48 hpf p = 0.332, 72 hpf p = 0.135, 96 hpf p = 0.147). (I, J) Immunofluorescent (IF) staining against meromyosin (MF20) (red) and atrial-specific myosin (S46) (green) demonstrated normal chamber specification of bal hearts. EXPRESSION / LABELING:
|
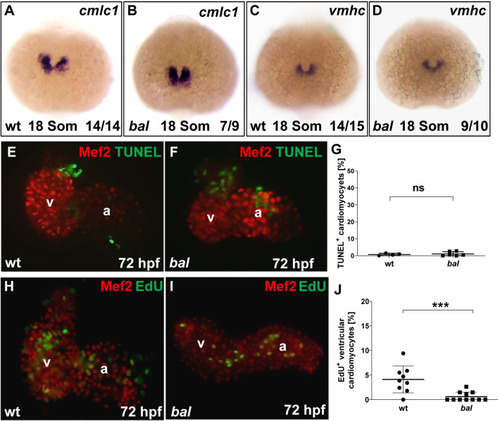
Early progenitor and chamber specification proceed normally in bal mutants.
(A-D) Whole-mount antisense RNA in situ hybridization (ISH) of cmlc1 and vmhc showed similar expression in bal mutants and wt siblings. (E, F) TUNEL staining (green) and IF for Mef2 (red) on dissected wt (E) and bal mutant hearts (F). (G) Quantification of TUNEL+ CMs revealed no alterations in apoptosis (wt 0.75 ± 0.70%, n = 4, bal 1.07 ± 1.28%, n = 6, p = 0.92), error bars indicate s.d., ns, not significant. (H, I) IF against Mef2 (red) and EdU (green) on dissected wt and bal hearts showed decreased numbers of EdU+ ventricular CMs. (J) Quantification revealed significantly decreased levels of EdU+ ventricular CMs in bal mutant hearts (wt 4.10 ± 2.73, n = 9, bal 0.61 ± 0.92, n = 11, p = 0.001). For significance testing Mann-Whitney-U test was applied, error bars indicate s.d., ***p < 0.001, ns, not significant. EXPRESSION / LABELING:
PHENOTYPE:
|

Bal phenotype is caused by a point mutation in the Hdac1 gene.
(A) Genetic map of the baldrian/Hdac1 gene locus. The bal mutation interval is flanked by the microsatellite markers z11872, z65805 and z3770. (B, C) Sequencing revealed the bal mutation to be a thymidine-to-guanine nucleotide transition in codon 125 within the zebrafish hdac1 gene. (D, D’) Homology model for Danio rerio Hdac1 (drHdac1), "type":"entrez-protein","attrs":{"text":"AAH85375","term_id":"55716026","term_text":"AAH85375"}}AAH85375, built from human HDAC1 structure 4BKX. wt and bal mutant structure of drHdac1, highlighting the active site zinc ion (cyan sphere) and L125. (D) Zoomed view of L125, showing the nonpolar interactions it makes with neighboring side chains within the hydrophobic core of drHDAC1. (D’) Modelled L125R mutant Hdac1. Steric clashes are represented as red disks. Modeled Arg rotamer was chosen based on the least number of steric clashes. (E-F”) IF staining on dissected hearts at 72 hpf, Hdac1 (turquoise) of Tg(myl7:mCherry) hearts (E-E”) or bal;Tg(myl7:mCherry) mutant hearts (F-F”) white arrows show Hdac1 costained cardiomyocytes of wt ventricle or atrium. (G) Western blot analysis of Hdac1 levels on protein lysates from bal and wt, demonstrating a drastic reduction in Hdac1 protein level in the bal mutants. (H) Western blot analysis of acetylation levels of Histone 3 (H3ac) and 4 (H4ac) of bal and wt protein lysates show a pronounced hyperacetylation of H3 and H4 in bal mutant embryos. pan Histone 3 served as loading control. EXPRESSION / LABELING:
PHENOTYPE:
|
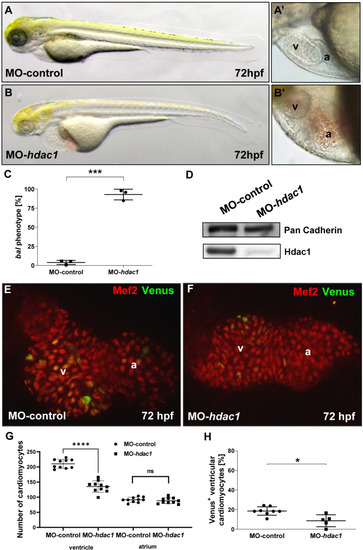
Morpholino-mediated knockdown of hdac1 phenocopies bal mutants.
(A-B’) Lateral view of MO-control (A, A’) and MO-hdac1 (B, B’) at 72 hpf, injection of MO-hdac1 led to the bal heart phenotype (B’). (C) Statistical analysis of MO-hdac1 injection. MO-hdac1 injection highly significantly (p = 0.0001) induced the bal phenotype (245/264) compared to Ctrl-MO (10/248). Significance was calculated using two-tailed t-test, error bars show s.d., asterisks indicate significance. (D) Western blot analysis of lysates either from MO-hdac1 or MO-control injected embryos depicting reduced Hdac1 protein levels in the morphants. (E, F) IF staining for Mef2 (red) and Venus (green) on dissected hearts from embryos either injected with MO-hdac1 (E) or MO-control (F). (G, H) Statistical analysis of CM number (G) and cycling CMs (H) demonstrated a reduced CM number in the ventricle (MO-control 210.2 ± 14.68, MO-hdac1 135,0 ± 19.06, n = 10, p < 0.0001) but not in the atrium (MO-control 91.20 ± 8.38, MO-hdac1 88.2 ± 9.57, n = 10, p = 0.2079). Furthermore, a decreased cycling rate (p = 0.01) was revealed in MO-hdac1 injected embryos (H). Error bars indicate s.d.; *p < 0.05, ****p < 0.0001, ns, not significant. EXPRESSION / LABELING:
PHENOTYPE:
|

Hdac1 mRNA injection rescues the bal phenotype.
(A-E) Lateral view of uninjected and hdac1 mRNA injected wildtyp (A, C) or bal embryos (B, D) at 72 hpf, injection of mRNA prevents the bal phenotype in mutant embryos (uninjected 0 ± 0%, hdac1 mRNA injected 47.4 ± 14.76%, n = 50 embryos). (F-I) Cardiomyocytes (red) in Tg(myl7:mCherry), bal;Tg(myl7:mCherry) and hdac1 mRNA injected bal;Tg(myl7:mCherry) hearts. Hdac1 mRNA injection prevents the loss of ventricular cardiomyocytes in bal mutant embryos. (J-N) Statistical analysis of pH3+ cardiomyocytes after hdac1 mRNA injection in bal;Tg(myl7:mCherry) mutant embyos (wt: 4.2 ± 1.40; bal: 0.9 ± 0.88; bal + hdac1 mRNA: 2.9 ± 1.37, n = 10) and the relative proliferation rate (wt: 2.19 ± 0.66%; bal: 0.70 ± 0.68%; bal + hdac1 mRNA: 1.48 ± 0.69%, n = 10). Error bars indicate s.d.; *p < 0.05, **p < 0.01, ***p < 0.001, ****p < 0.0001, ns, not significant. EXPRESSION / LABELING:
PHENOTYPE:
|
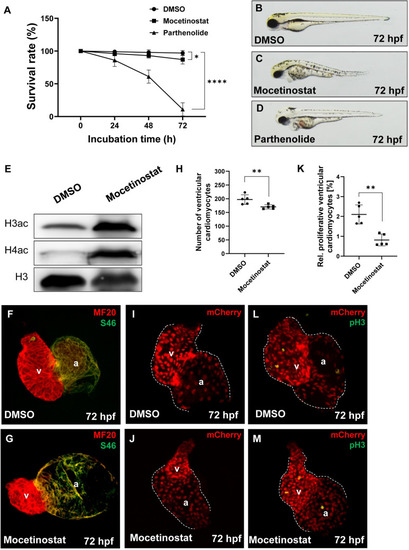
Mocetinostat treatment of zebrafish embryos induces the bal phenotype.
(A) Survival rate of Mocetinostat- and Parthenolide-treated embryos, compared to the DMSO control. At 24 hpf (DMSO: 99.0 ± 2.0%; Mocetinostat: 96.0 ± 3.27%; Parthenolide: 86.0 ± 9.52%, n = 4), at 48 hpf (DMSO: 98.0 ± 4.0%; Mocetinostat: 93.0 ± 3.83%; Parthenolide: 61.0 ± 10.0%, n = 4) and at 72 hpf (DMSO: 97.0 ± 3.83%; Mocetinostat: 87.0 ± 6.83%; Parthenolide: 11.0 ± 10.0%, n = 4). (B-D) Lateral view of inhibitor- or DMSO-treated embryos at 72 hpf. (E) Western blot analysis of acetylation levels of Histone 3 (H3ac) and 4 (H4ac) of lystes from Mocetinostat and DMSO-treated embryos, show a pronounced hyperacetylation of H3 and H4 in Mocetinostat-treated embryos. pan Histone 3 served as a loading control. (F-G) IF staining against meromyosin (MF20) (red) and atrial-specific myosion (S46) (green) demonstrated normal chamber specification of Mocetinostat-treated hearts. (H-J) Number of ventricular cardiomyocytes was reduced in Mocetinostat treated Tg(myl7:mCherry) embryos (DMSO: 197.0 ± 17.39; Mocetinostat: 170.4 ± 7.7, n = 5). (K-M) The rate of ventricular pH3+ cardiomyocytes was reduced in Mocetinostat-treated embryos as well (DMSO: 2.1 ± 0.48%; Mocetinostat: 0.8± 0.30%, n = 5). Error bars indicate s.d., *p < 0.05, **p < 0.01, ****p < 0.0001. EXPRESSION / LABELING:
PHENOTYPE:
|
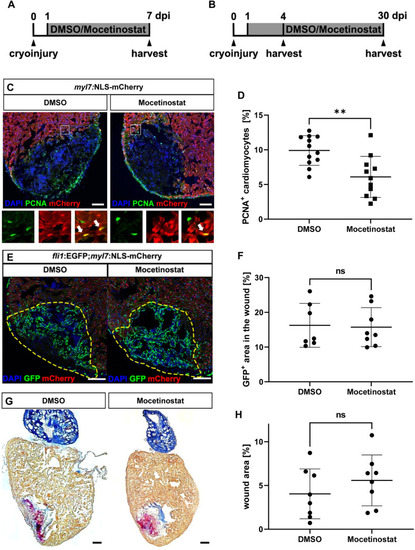
Hdac1 is involved in heart regeneration after cryoinjury.
(A, B) Experimental timeline of cryoinjury, treatment and harvesting of the hearts for the analysis of cardiomyocyte proliferation (A) revascularization (4 dpi) and scar formation (30 dpi) (B). (C, D) Immunohistochemistry for mCherry (red, cardiomyocytes) and PCNA (green) on 7 dpi hearts of Tg(myl7:NLS-mCherry) fish treated with either DMSO or Mocetinostat from 1 to 7 dpi, showed reduced rate of cycling cardiomyocytes at the wound border zone in Mocetinostat-treated hearts (% of PCNA+/mCherry+ cardiomyocytes DMSO 9.91 ± 2.14, n = 12, Mocetinostat 6.1 ± 2.96, n = 11, p = 0.0018). (E, F) Native GFP (green, endothelial cells) and mCherry (red, cardiomyocytes) fluorescence in 4 dpi hearts of Tg(fli:GFPy1;myl7:NLS-mCherry) fish treated with DMSO or Mocetinostat from 12 hpi to 4 dpi, showed no changes in revascularization (% of GFP+ wound area: DMSO Ctrl 16.26 ± 6.34, n = 7, Mocetinostat 15.74 ± 5.62, n = 8, p > 0.9999). (G, H) Acid Fuchsin Orange G (AFOG) staining of 30 dpi hearts treated with DMSO or Mocetinostat from 1 to 30 dpi, have no significant difference in wound size (DMSO 4.05 ± 4.85, n = 8, Mocetinostat 5.59 ± 2.91, n = 8, p = 0.3282). Error bars indicate s.d.; **p < 0.01, ns, not significant. Scale bars, 100 μm. |