
- Title
-
A specialized spinal circuit for command amplification and directionality during escape behavior
- Authors
- Guan, N.N., Xu, L., Zhang, T., Huang, C.X., Wang, Z., Dahlberg, E., Wang, H., Wang, F., Pallucchi, I., Hua, Y., El Manira, A., Song, J.
- Source
- Full text @ Proc. Natl. Acad. Sci. USA
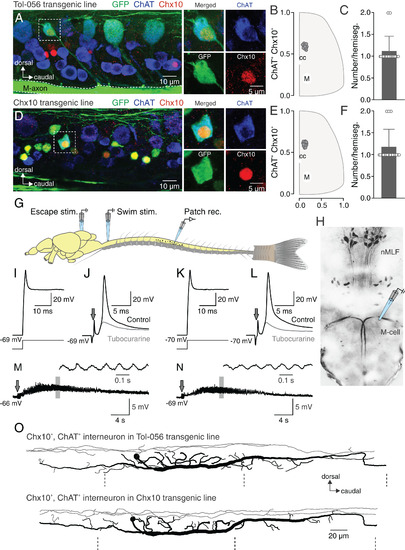
esV2a interneurons involved in escape behavior. (A) Lateral view of a spinal segment from Tol-056 enhancer trap transgenic zebrafish line with immunohistochemical staining. The dashed box indicates a specific interneuron expressing GFP (green) that colocalizes both Chx10 (red) and ChAT (blue). This neuron is shown specifically on the right four boxes. (B) Distribution of esV2a interneurons in the spinal cord from the Tol-056 transgenic line (cc: central canal; M: M-axon). Data are from multiple fish and multiple segments. (C) Quantification of esV2a interneurons per hemisegment in Tol-056 transgenic line. The graph shows mean ± SD; n = 16. (D) Lateral view of a spinal segment from Tg(Chx10:GFP) transgenic line with immunohistochemical staining. A specific GFP expressing neuron (green) in the dashed box was immunoreactive for both Chx10 (red) and ChAT (blue) shown specifically in the right four boxes. Yellow represents noncholinergic V2a interneurons that express GFP (green) and Chx10 (red). (E) Distribution of esV2a interneurons in the spinal cord from Tg(Chx10:GFP) transgenic line (cc: central canal; M: M-axon). (F) Quantification of esV2a interneurons per hemisegment in Tg(Chx10:GFP), the graph shows mean ± SD; n = 16. (G) Experimental setup of the ex vivo preparation showing the sites for extracellular stimulation and whole-cell patch-clamp recordings. (H) Dorsal view of descending neurons in the zebrafish hindbrain revealed by retrograde labeling from the spinal cord. (I) esV2a neuron in Tol-056 transgenic line discharged a single action potential in response to a prolonged depolarizing current injection. (J) The same esV2a neuron as in I, receiving a strong cholinergic cEPSP from an M-cell that was blocked by d-tubocurarine leaving on an eEPSP. Arrow indicates electrical stimulation. (K) An esV2a neuron in Tg(Chx10:GFP) firing a single action potential in response to a prolonged depolarizing current injection. (L) The same esV2a neuron as in K receiving a strong cholinergic cEPSP by an M-cell stimulation that was blocked by d-tubocurarine leaving only an eEPSP. Arrow indicates electrical stimulation. (M) An esV2a interneuron recorded in the Tol-056 line was not recruited during swimming activity (same interneuron as in I and J). Arrow indicates electrical stimulation. (N) An esV2a interneuron recorded in the Tg(Chx10:GFP) line was not recruited during swimming activity (same interneuron as in K and L). Arrow indicates electrical stimulation. (O) Morphology of an esV2a neuron in Tol-056 line (Upper) and Tg(Chx10:GFP) (Lower). Gray line representing the dendrite and black representing the soma and axonal projections. The dashed lines indicating the segmental boundaries. |
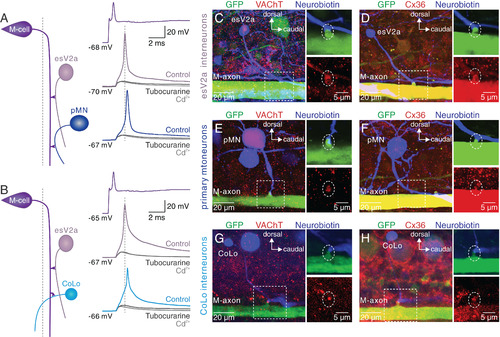
esV2a interneurons are recruited prior to pMNs and CoLo interneurons. (A) Triple whole-cell patch-clamp recording from an M-cell, an esV2a interneuron and a pMN. M-cell activation recruited first the esV2a interneuron and then the pMN. d-tubocurarine suppressed the firing of both neurons and only a Cd2+-insensitive eEPSP remained. (B) Triple whole-cell patch-clamp recording from an M-cell, an esV2a interneuron and a CoLo interneuron. The latter was recruited later than the esV2a interneuron. The cholinergic cEPSPs in both neurons were blocked by d-tubocurarine, leaving only an eEPSP remained that was unaffected by Cd2+. (C) Direct contact between the M-axon (green) and the axon of an esV2a interneuron (blue). VAChT (red) was expressed at the site of presumed synaptic contact (dashed box, Left). The large soma corresponds to a pMN expressing GFP in this line. (D) Expression of Cx36 (red) at the site of synaptic connections between the M-axon and esV2a interneuron (blue). (E) The expression of VAChT (red) was found at the presumed synaptic contact site between an M-axon (green) and a pMN (blue). (F) Cx36 (red) is expressed at the connection site between the M-axon and pMN. (G) The expression of VAChT (red) was found at the presumed synaptic contact site between an M-axon (green) and a CoLo interneuron (blue). (H) Expression of Cx36 (red) at the connection site between the M-axon and CoLo interneuron. The Right Upper and Lower panels in C–H represent magnification of the regions indicated by the dashed boxes in the Left panels. The white dotted circle indicates the synapses formed by the M-cell and spinal neurons. |
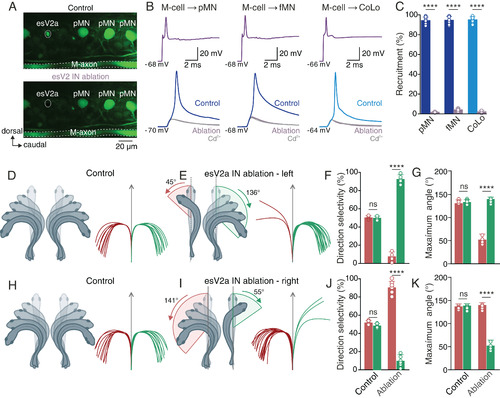
Ablation of spinal esV2a interneurons suppresses the transmission of the escape command and the behavioral laterality in vivo. (A) Two-photon microscope images of the spinal cord before (Upper) and after laser ablation (Lower) of an esV2a interneuron. (B) Ablation of esV2a interneurons eliminated the ability of the M-cell to elicit an action potential in a pMN, an fMN, and a CoLo interneuron. Only direct electrical transmission from the M-cell remained and was unaffected by Cd2+. (C) Quantification of the probability of recruitment of pMNs, fMNs, and CoLo interneurons before and after esV2a interneuron ablation. Graph shows mean ± SD, n = 7 each; Student’s t test, P = 1 × 10⁻⁷ for pMN, P = 8 × 10⁻⁶ for fMN, and P = 6 × 10⁻⁷ for CoLo. Each dot represents the data from single neurons. (D) In freely behaving zebrafish in vivo, the direction of escape behavior was flexible in response to a brief sound stimulation from a constant source location. Zebrafish produced escape behavior directed toward both directions. (E) In animals with ablation of esV2a interneurons on the left side of spinal cord, escape was almost exclusively directed toward the intact side of the spinal cord. The maximum body bending angle was shallower toward the ablated side. (F) Quantification of the directional selectivity of escape behavior before and after esV2a interneuron ablation. Data in the graph represent mean ± SD; Student’s t test, P > 0.5 for control; P = 4 × 10⁻⁵ for ablation, n = 8 for each group. (G) Maximum body bending angle in control and in ablated fish. Data in the graph represent mean ± SD; Student’s t test, P > 0.5 for control; P = 9 × 10⁻⁵ for ablation, n = 8 for each group. (H) Control zebrafish were able to escape in both direction in response to sound stimulation. (I) After ablation of esV2a interneurons on the right side of spinal cord, the direction of escape was confined toward the intact side of the spinal cord. (J) Quantification of the directionality of escape before and after esV2a interneuron ablation. Data in the graph represent mean ± SD; Student’s t test, P > 0.5 for control; P = 3 × 10⁻⁶ for ablation, n = 7 for each group. Each dot represents the data from single animals. (K) Maximum body bending angle in control and in ablated fish. Data in the graph represent mean ± SD; Student’s t test, P > 0.5 for control; P = 8 × 10⁻⁶ for ablation, n = 7 for each group. Each dot represents the data from single animals. The red and green traces in D–L represent tracking of sound induced escape in all the 20 trials in a single fish; right and left directions are represented as green and red, respectively. |

Connectome of spinal escape neural circuit revealed by SBEM. (A) Workflow of acquiring three-dimensional electron microscopy volume from adult zebrafish spinal cord. The images were centered at the central canal and covered the entire spinal cord cross-section; 7,095 cuts along the axial direction were performed, resulting in a final dimension of 171 × 153 × 248 μm3. Skeletonized reconstruction was done by human annotations. (B) Skeletonized neurites of eight pMNs (navy blue, larger soma size), two esV2a interneurons (purple), two CoLo interneurons (sky blue), two fMNs (navy blue, smaller soma size), as well as two M-axons (green) contained in the dataset. Dashed line indicating the spinal central canal. (C) The contralateral view of connectomes of the right M-axon (green), R-esV2a interneuron (purple), R-pMN2 (navy blue), and R-CoLo (sky blue) in the right side of the spinal cord. The collateral of M-axon made putative axo-axonal synaptic contacts with the R-esV2a interneuron (purple), the R-pMN2 (navy blue), and the R-CoLo interneurons (sky blue). (D) Volume reconstruction (Left) and electron micrographs (Right) of the indicated synaptic contacts in C (purple and navy blue arrow). The second collateral of the right M-axon made synaptic contacts with both the R-esV2a interneuron and the R-pMN2. Vesicle cluster (indicated by white arrows) in the terminal of the M-axon collateral (Right, green arrow) was found in the vicinity of the R-esV2a interneuron (Right, purple dot), but not of the pMN2 (Right, navy blue dot). (E) Volume reconstruction (Left) and electron micrograph (Right) of the indicated synaptic contact. The third collateral of the left M-axon made synaptic contacts with axon of a L-pMN2. No vesicle cluster in the terminal of M-axon collateral (Right, green arrow) was found in the vicinity of the L-pMN1 axon (Right, navy blue dot). (F) Volume reconstruction (Left) and electron micrograph (Right) of the indicated synaptic contacts in C. The fifth collateral of the right M-axon made synaptic contacts with the R-CoLo interneuron. No vesicle cluster in the terminal of right M-axon collateral (Right, green arrow) was found in the vicinity of the R-CoLo axon (Right, sky blue dot). (G) The wiring diagram between right M-axon with the three types of spinal interneurons in the right side of the spinal cord. M-axon formed putative synapses with the esV2a interneurons, the CoLo interneuron and pMNs. (H, Left) The drawing showing the distance between vesicles and presynaptic membrane. (Right) Statistic results suggest the different distance for esV2a interneurons and pMNs (Student’s t test, n = 30; P = 1 × 10⁻⁶ for L-esV2a and L-pMN1; n = 30; P = 5 × 10⁻⁵ for R-esV2a and R-pMNs). Each dot represents the data from single vesicles. (I) Lateral view of connectomes of a presynaptic L-esV2a interneuron (purple) with a postsynaptic L-CoLo interneuron (sky blue), L-pMN4 (navy blue), and L-fMN (navy blue) on the left side of spinal cord in B. Chemical synapses (purple dots) were formed between the axon of presynaptic L-esV2a interneuron and the axon of the postsynaptic L-CoLo interneuron (sky blue), L-pMN4 (navy blue, larger soma size), and L-fMN (navy blue, smaller soma size). Electron micrographs (I1, I2, and I3) showing the indicated synaptic contacts. Colored arrows indicating the location and standing for the neuronal types. (J) Connectomes of a presynaptic L-CoLo interneuron with a postsynaptic R-esV2a interneuron (purple) and a postsynaptic R-pMN2 (navy blue) on the contralateral side of spinal cord in the dorsal view. The presynaptic L-CoLo interneuron made axo-axonic synapses (sky blue dots) with the contralateral pMN (navy blue) and cholinergic esV2a interneuron (purple). Electron micrographs (J1 and J2) showing the indicated synaptic contacts. Colored arrows indicating the location and standing for the neuronal types. (Scale bars in B, C, I, and J: 20 μm; in D–F, Left: 5 μm; D–F, Right: 500 nm; and in I1 to I3 and J1 and J2: 500 nm.) |
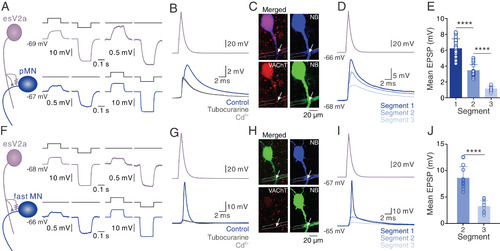
esV2a interneurons drive ipsilateral escape MNs. (A) Dual whole-cell patch-clamp recording from an esV2a interneuron and a pMN connected via bidirectional electrical coupling. (B) Stimulation of the esV2a interneuron induced monosynaptic EPSPs in the pMN whose chemical component was blocked by d-tubocurarine, leaving only the Cd2+-insensitive eEPSP. (C) Confocal images showing VAChT (red) expressing at the crossing site (white arrow) between the axon of the esV2a interneuron (dashed line) and the pMN (blue); same neurons as in B. The green channel is the same as the blue channel and represents a pseudocoloring of neurobiotin filled neurons for better visibility. (D) The EPSP amplitude was highest in the pMN in the same segment as the esV2a interneuron and decreased in more caudal segments. (E) Quantification of the mean EPSP amplitude based on the segmental location of the pMNs relative to the recorded esV2a interneuron (each bar represents mean ± SD, segment 1: n = 16; segment 2: n = 15; segment 3: n = 12; one-way ANOVA, P = 2 × 10⁻⁵ for segment 1 vs. segment 2; P = 0.5 × 10⁻⁶ for segment 2 vs. segment 3). Each dot represents the data from single neurons. (F) Dual whole-cell patch-clamp recording between an esV2a interneuron and a fMN showing bidirectional electrical coupling. (G) Single action potential in an esV2a interneuron induced an action potential in a caudal fMN that was blocked by d-tubocurarine leaving only an eEPSP that was unaffected by Cd2+. (H) Confocal images showing VAChT (red) expressing at the crossing site (white arrow) between the axon of the esV2a interneuron (dashed line) and the fMN (blue); same neurons as in G. The green channel is the same as the blue channel and represents a pseudocoloring of neurobiotin filled neurons for better visibility. (I) The EPSP in fMN in the same segment as the esV2a interneuron was highest and reached firing threshold, and it decreased in fMNs located in more caudal segments. (J) Quantification of the mean EPSP amplitude amplitude based on the segmental location of the fMNs relative to the recorded esV2a interneuron (each bar represents mean ± SD, segment 1: n = 15; segment 2: n = 10; segment 3: n = 9; paired t test, P = 0.3 × 10⁻⁵ for segment 2 vs. segment 3). EPSPs in fMNs in segment 1 could not be quantified because they were always suprathreshold. Each dot represents the data from a single neuron. |
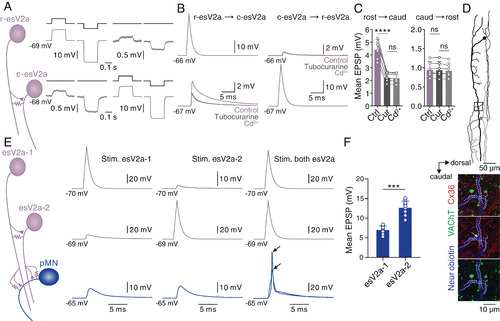
Feedforward excitation between esV2a interneurons and convergence onto pMNs. (A) Dual whole-cell patch-clamp recording from a rostral and a caudal esV2a interneuron that were electrically coupled. (B) Chemical synaptic transmission occurred only from the rostral to the caudal esV2a interneuron. (C) Quantification of the mean amplitude of synaptic potentials between esV2a interneurons. The Left graph represents data from rostral to caudal esV2a interneuron as mean ± SD, n = 6; one-way ANOVA, P = 6 × 10⁻⁶ for control vs. d-tubocurarine (Cur); P > 0.05 for d-tubocurarine vs. Cd2+. The Right graph represents data from caudal to rostral esV2a interneuron as mean ± SD, n = 6; one-way ANOVA, P > 0.05 for control vs. d-tubocurarine; P > 0.05 for d-tubocurarine vs. Cd2+. Each dot represents the data from single neurons. (D) Reconstruction of the two recorded esV2a interneurons (Upper). (Lower) Coexpression of VAChT (green) and Cx36 (red and indicated by a white arrow) at the crossing point of their axons (blue) that represents the presumed site of contact located in the segment of the caudal esV2a interneuron. These images correspond to the region indicated in the box of the Upper panel. The axon of esV2a interneurons is indicated by the dashed lines. (E) Triple whole-cell patch-clamp recordings from two rostral esV2a interneurons and a pMN. Each esV2a interneuron produced subthreshold EPSPs in the pMN, which was recruited by the convergent input from the two interneurons. Two superimposed traces are shown to indicate the reliability of firing and variability in spike amplitude. Black arrows indicate the peaks of two spikes. (F) Quantification of the mean EPSP amplitude induced in pMNs by each esV2a interneuron. The graph represents mean ± SD, n = 13; paired t test, P = 0.8 × 10⁻⁴. Each dot represents the data from a single neuron. |

Feedforward excitation and inhibition between esV2a interneurons and CoLo interneurons, respectively. (A) Dual whole-cell patch-clamp recording from a rostral esV2a interneuron and an ipsilateral caudal CoLo interneuron (the dashed line indicates the middle line of spinal cord). esV2a interneurons made mixed electrical and chemical synapses with CoLo interneurons. (B) Quantification of the mean amplitude of monosynaptic EPSPs in CoLo interneurons. The graph shows mean ± SD, n = 7; one-way ANOVA, P = 7.5 × 10⁻⁵ for control vs. d-tubocurarine; P > 0.05 for d-tubocurarine vs. Cd2+. (C) The same pair of esV2a interneuron and CoLo interneuron as in A in which EPSCs were examined. (D) Quantification of the mean amplitude of the monosynaptic EPSCs elicited in CoLo interneurons. Graph represents mean ± SD, n = 7; one-way ANOVA, P = 8.2 × 10⁻⁵ for control vs. d-tubocurarine; P > 0.05 for d-tubocurarine vs. Cd2+. Each dot represents the data from single neurons. (E) Reconstruction of a recorded esV2a interneuron and CoLo interneuron (Left). Confocal image showing the coexpression of VAChT (green) and Cx36 (red and indicated by white arrows) at the site of synaptic contacts between the axons of the two interneurons (blue and indicated by the dashed lines). These images correspond to the region indicated in the box of the Left panel. (F) Dual whole-cell patch-clamp recording of an esV2a interneuron and a contralateral CoLo interneuron (the dashed line indicates the middle line of spinal cord). Single action potentials in CoLo interneuron elicited IPSCs in esV2a interneuron that were blocked by strychnine. (G) Quantification of the effect of strychnine on the mean amplitude of monosynaptic IPSCs. Data are presented as mean ± SD, n = 6; paired t test, P = 6.3 × 10⁻⁷. Each dot represents the data from a single neuron. (H) Lateral view of the reconstruction of the pair of CoLo and esV2a interneuron shown in F. GlyT2 was expressed at the site of presumed synaptic contact between CoLo and esV2a interneuron axon (arrows). |