
Fig. 5
- ID
- ZDB-IMAGE-221128-30
- Publication
- Guan et al., 2021 - A specialized spinal circuit for command amplification and directionality during escape behavior
- All Figures
- Figures for Guan et al., 2021
|
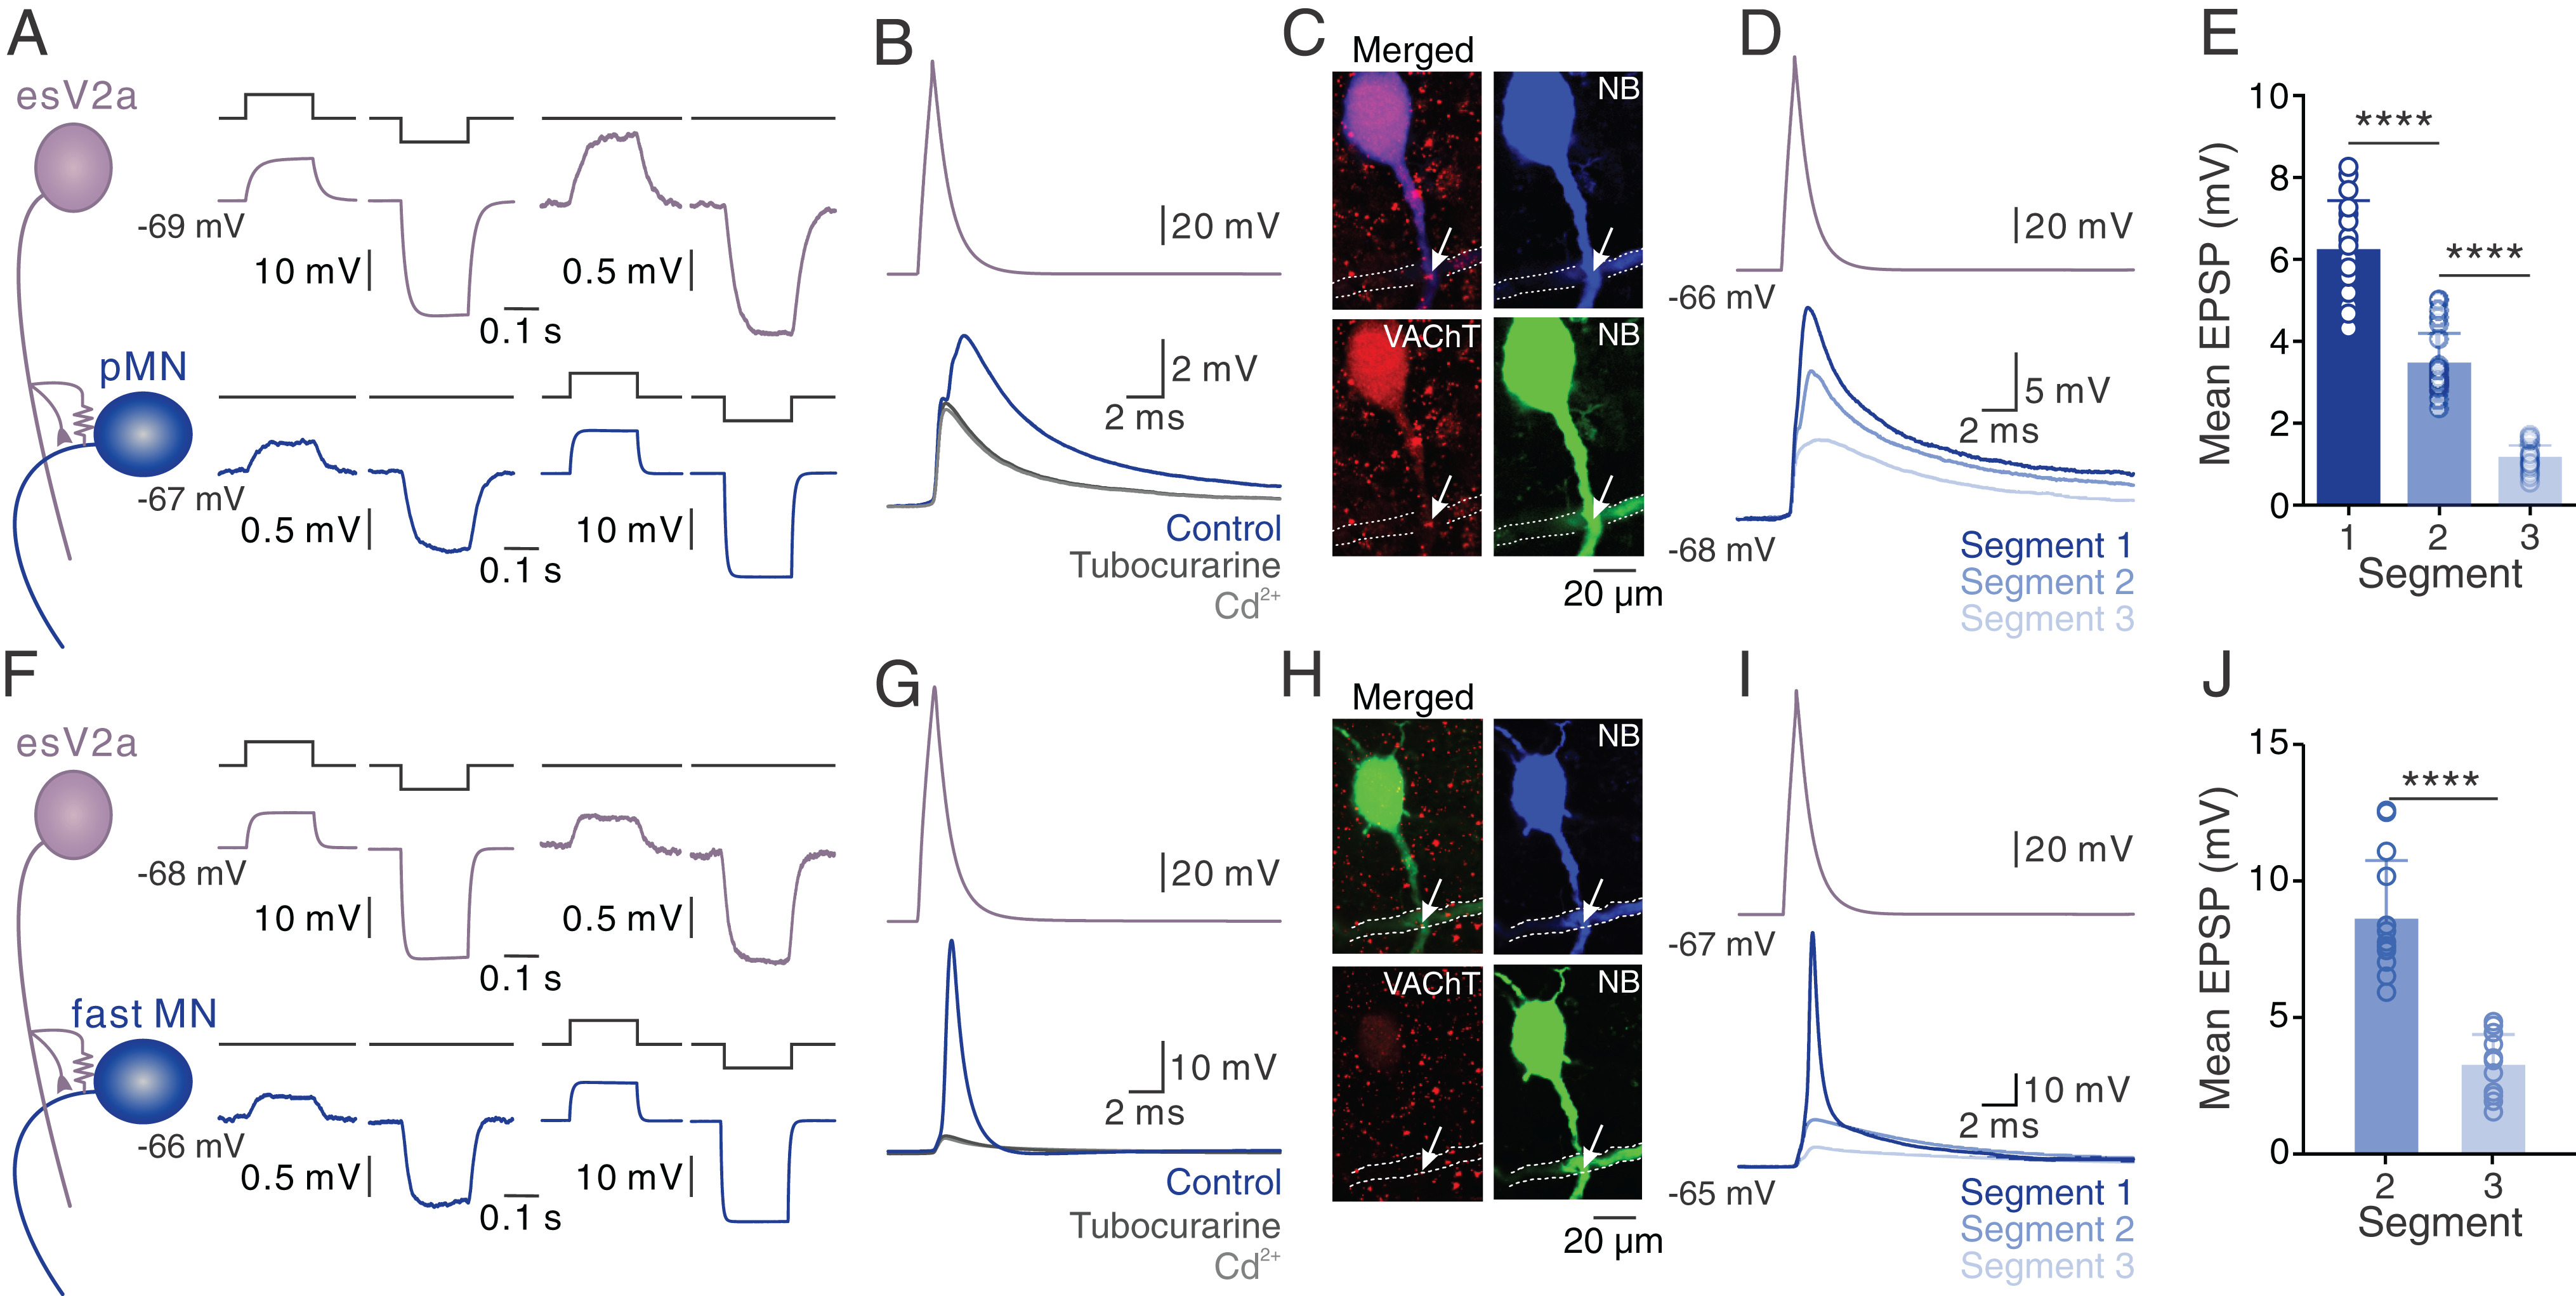
Fig. 5 esV2a interneurons drive ipsilateral escape MNs. (A) Dual whole-cell patch-clamp recording from an esV2a interneuron and a pMN connected via bidirectional electrical coupling. (B) Stimulation of the esV2a interneuron induced monosynaptic EPSPs in the pMN whose chemical component was blocked by d-tubocurarine, leaving only the Cd2+-insensitive eEPSP. (C) Confocal images showing VAChT (red) expressing at the crossing site (white arrow) between the axon of the esV2a interneuron (dashed line) and the pMN (blue); same neurons as in B. The green channel is the same as the blue channel and represents a pseudocoloring of neurobiotin filled neurons for better visibility. (D) The EPSP amplitude was highest in the pMN in the same segment as the esV2a interneuron and decreased in more caudal segments. (E) Quantification of the mean EPSP amplitude based on the segmental location of the pMNs relative to the recorded esV2a interneuron (each bar represents mean ± SD, segment 1: n = 16; segment 2: n = 15; segment 3: n = 12; one-way ANOVA, P = 2 × 10⁻⁵ for segment 1 vs. segment 2; P = 0.5 × 10⁻⁶ for segment 2 vs. segment 3). Each dot represents the data from single neurons. (F) Dual whole-cell patch-clamp recording between an esV2a interneuron and a fMN showing bidirectional electrical coupling. (G) Single action potential in an esV2a interneuron induced an action potential in a caudal fMN that was blocked by d-tubocurarine leaving only an eEPSP that was unaffected by Cd2+. (H) Confocal images showing VAChT (red) expressing at the crossing site (white arrow) between the axon of the esV2a interneuron (dashed line) and the fMN (blue); same neurons as in G. The green channel is the same as the blue channel and represents a pseudocoloring of neurobiotin filled neurons for better visibility. (I) The EPSP in fMN in the same segment as the esV2a interneuron was highest and reached firing threshold, and it decreased in fMNs located in more caudal segments. (J) Quantification of the mean EPSP amplitude amplitude based on the segmental location of the fMNs relative to the recorded esV2a interneuron (each bar represents mean ± SD, segment 1: n = 15; segment 2: n = 10; segment 3: n = 9; paired t test, P = 0.3 × 10⁻⁵ for segment 2 vs. segment 3). EPSPs in fMNs in segment 1 could not be quantified because they were always suprathreshold. Each dot represents the data from a single neuron.