
Fig. 3
- ID
- ZDB-FIG-221128-42
- Publication
- Guan et al., 2021 - A specialized spinal circuit for command amplification and directionality during escape behavior
- Other Figures
- All Figure Page
- Back to All Figure Page
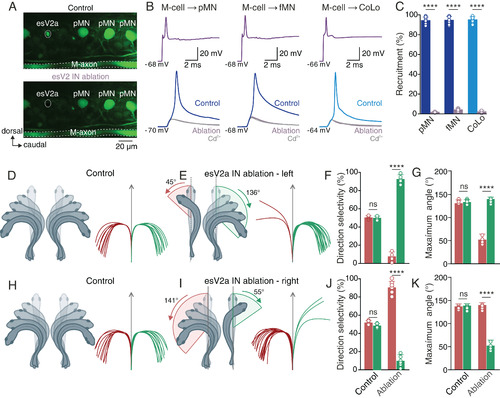
Ablation of spinal esV2a interneurons suppresses the transmission of the escape command and the behavioral laterality in vivo. (A) Two-photon microscope images of the spinal cord before (Upper) and after laser ablation (Lower) of an esV2a interneuron. (B) Ablation of esV2a interneurons eliminated the ability of the M-cell to elicit an action potential in a pMN, an fMN, and a CoLo interneuron. Only direct electrical transmission from the M-cell remained and was unaffected by Cd2+. (C) Quantification of the probability of recruitment of pMNs, fMNs, and CoLo interneurons before and after esV2a interneuron ablation. Graph shows mean ± SD, n = 7 each; Student’s t test, P = 1 × 10⁻⁷ for pMN, P = 8 × 10⁻⁶ for fMN, and P = 6 × 10⁻⁷ for CoLo. Each dot represents the data from single neurons. (D) In freely behaving zebrafish in vivo, the direction of escape behavior was flexible in response to a brief sound stimulation from a constant source location. Zebrafish produced escape behavior directed toward both directions. (E) In animals with ablation of esV2a interneurons on the left side of spinal cord, escape was almost exclusively directed toward the intact side of the spinal cord. The maximum body bending angle was shallower toward the ablated side. (F) Quantification of the directional selectivity of escape behavior before and after esV2a interneuron ablation. Data in the graph represent mean ± SD; Student’s t test, P > 0.5 for control; P = 4 × 10⁻⁵ for ablation, n = 8 for each group. (G) Maximum body bending angle in control and in ablated fish. Data in the graph represent mean ± SD; Student’s t test, P > 0.5 for control; P = 9 × 10⁻⁵ for ablation, n = 8 for each group. (H) Control zebrafish were able to escape in both direction in response to sound stimulation. (I) After ablation of esV2a interneurons on the right side of spinal cord, the direction of escape was confined toward the intact side of the spinal cord. (J) Quantification of the directionality of escape before and after esV2a interneuron ablation. Data in the graph represent mean ± SD; Student’s t test, P > 0.5 for control; P = 3 × 10⁻⁶ for ablation, n = 7 for each group. Each dot represents the data from single animals. (K) Maximum body bending angle in control and in ablated fish. Data in the graph represent mean ± SD; Student’s t test, P > 0.5 for control; P = 8 × 10⁻⁶ for ablation, n = 7 for each group. Each dot represents the data from single animals. The red and green traces in D–L represent tracking of sound induced escape in all the 20 trials in a single fish; right and left directions are represented as green and red, respectively. |