
- Title
-
NMR and EPR-DEER Structure of a Dimeric Guanylate Cyclase Activator Protein-5 from Zebrafish Photoreceptors
- Authors
- Cudia, D., Roseman, G.P., Assafa, T.E., Shahu, M.K., Scholten, A., Menke-Sell, S.K., Yamada, H., Koch, K.W., Milhauser, G., Ames, J.B.
- Source
- Full text @ Biochemistry
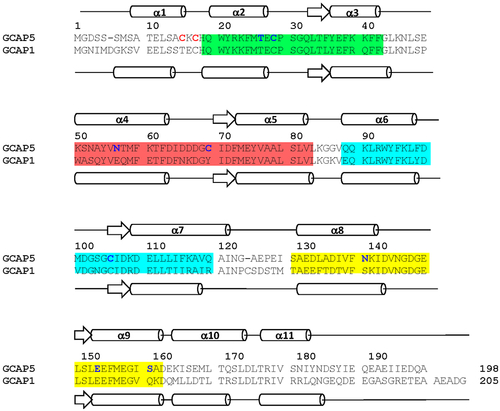
Amino acid sequence alignment and secondary structure of GCAP1 and GCAP5. EF-hand motifs are shaded in color (green for EF1, red for EF2, cyan for EF3, and yellow for EF4). Nonconserved cysteine residues (C15 and C17) in GCAP5 are highlighted in red. Single cysteine residues (C15, C17, T26C, C28, N56C, C69, C105, N139C, E152C, and S158C) modified by nitroxide for DEER studies are highlighted in blue. ?-Helices and ?-strands are depicted by cylinders and arrows, respectively. Swiss Protein Database accession numbers are Q90WX4 (bovine GCAP1) and Q5MAC8 (zebrafish GCAP5). |
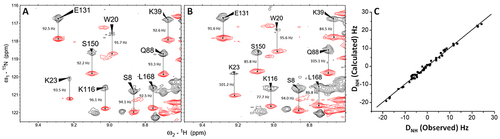
Residual dipolar coupling (RDC) structural analysis of GCAP5. 1H?15N IPAP-HSQC spectra of Mg2+-bound GCAP5 in the (A) absence and (B) presence of 12 mg/mL Pf1 phage. Observed spectral splittings in the absence of Pf1 (JNH) and presence of Pf1 (JNH + DNH) are marked by vertical lines, and their difference was used to calculate RDCs as described in Materials and Methods. (C) RDCs calculated from the structure of Mg2+-bound GCAP5 in Figure 3 plotted vs the RDCs measured in panel B show good agreement (Q-factor = 0.27, and R-factor = 0.98532). |

NMR-derived structures of Mg2+-bound GCAP5 (PDB entry 7M2M). (A) Ensemble of the 10 lowest-energy NMR structures. Structural statistics are listed in Table 1. (B) Average main chain structure of GCAP5 and (C) the same view rotated by 180� showing four EF-hands (colored as in Figure 1) packed in a globular arrangement very similar to what is seen for Ca2+-bound GCAP1.9 (D) Overlay of the main chain structure of GCAP5 (cyan) and the crystal structure of GCAP1 (red). The secondary structural elements are labeled as defined in Figure 1. The Ca2+ switch helix (?10) is colored purple. Cys15 and Cys17 side chain atoms are colored yellow. Bound Mg2+ is colored orange. The N-terminal myristoyl group is colored magenta. Side chain atoms of residues at the dimer interface (H18, Y21, M25, F72, and V76) and Mg2+ binding site (D63, D65, and D67) are indicated as sticks. (D) Overlay of main chain structures of Ca2+-bound GCAP1 (red) and Ca2+-free, Mg2+-bound GCAP5 (cyan). |
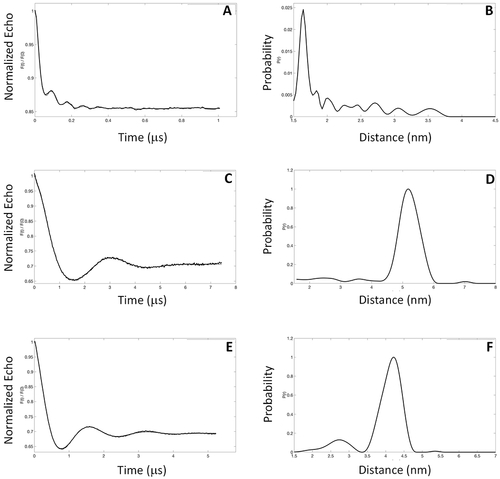
EPR-DEER intermolecular distances for the GCAP5 dimer. Representative EPR-DEER data of (A) GCAP5CL(A28C), (C) GCAP5CL(N56C), and (E) GCAP5CL(A69C) and corresponding distance distributions of (B) GCAP5CL(A28C), (D) GCAP5cl(N56C), and (F) GCAP5CL(A69C). GCAP5 samples were in the Ca2+-free, Mg2+-bound state. Similar DEER data were observed for GCAP5 in the Ca2+-bound state (not shown). A nitroxide spin-label (MTSSL) was covalently attached to the sole Cys residue in each mutant. The distance distributions and average intermolecular distances were calculated on the basis of the DEER data as described in Materials and Methods. The DEER intermolecular distances were measured to be 16 � 1 � [GCAP5CL(A28C) in panel B], 52 � 3 � [GCAP5CL(N56C) in panel D], and 41 � 3 � [GCAP5CL(A69C) in panel F]. |

Structural model of the GCAP5 dimer. (A) Ribbon diagram of the main chain structure of the GCAP5 dimer derived from DEER intermolecular distances listed in Table 2. The dimer subunits are colored cyan and yellow. Representative spin-labeled Cys residues for DEER studies (C28, N56C, C69, and C105) are colored magenta. Side chain atoms of residues at the dimer interface (H18, Y21, M25, F72, V76, and W93) are represented as sticks and are colored red. (B) Close-up of the dimer interface showing intermolecular contacts between aromatic residues. The side chain atoms of H18, F72, and W93 are colored red. (C) Close-up f the intermolecular salt bridge between R22 and D71. |

Activation of photoreceptor guanylate cyclase by GCAP5 mutants. Purified myristoylated GCAP5 wild type (WT), Cys-less (5A), and variants (H18A/Y21A, H18E/Y21E, R22A, R22D, M25E, N56C, N139C, and S159C) were incubated with HEK293 cell membrane suspensions containing photoreceptor human guanylate cyclase (GC-E). The concentrations of wild type GCAP5 and variants were each 3 ?M, and the free Ca2+ concentration was adjusted to 30 ?M (dark gray bar) or 10 nM (light gray bar) using a Ca2+/EGTA buffer system. |

NMR and SEC-MALS of GCAP5 dimerization site mutants. (A) 1H?15N HSQC spectra of 15N-labeled GCAP5M25E (red) and GCAP5WT (black). (B) 1H?15N HSQC spectra of 15N-labeled GCAP5H18E/Y21E (red) and GCAP5WT (black). (C) Ion exchange chromatogram to isolate the monomeric fraction (marked by an asterisk) of GCAP5H18E/Y21E. (D) Size exclusion chromatogram of GCAP5H18E/Y21E. (E) MALS Zimm plot analysis of the monomeric fraction of GCAP5H18E/Y21E that determined a molar mass of 24 � 2 kDa. (F) Ion exchange chromatogram to isolate a monomeric fraction (marked by an asterisk) of GCAP5R22D. (G) Size exclusion chromatogram of GCAP5R22D. (H) MALS Zimm plot analysis of GCAP5R22D that determined a molar mass of 29 � 4 kDa. The experimental conditions for MALS are given in Materials and Methods. |

Fe2+-dependent structural changes in GCAP5. Schematic model of dimeric GCAP5 in the Fe2+-free activator state (left) and Fe2+-bound inactive state (right). A single bound Fe2+ is chelated by sulfhydryl side chains of Cys15 and Cys17 from both protein subunits of the GCAP5 dimer. The intermolecular distance between the Cys15 sulfhydryl group is depicted by a double arrow. GCAP5 residues (H18, Y21, M25, F73, V76, and W93) implicated previously in the binding to guanylate cyclase54,55 are represented by red ovals, and the putative cyclase binding site is shown by a dotted circle. |