
Image
|
Figure Caption
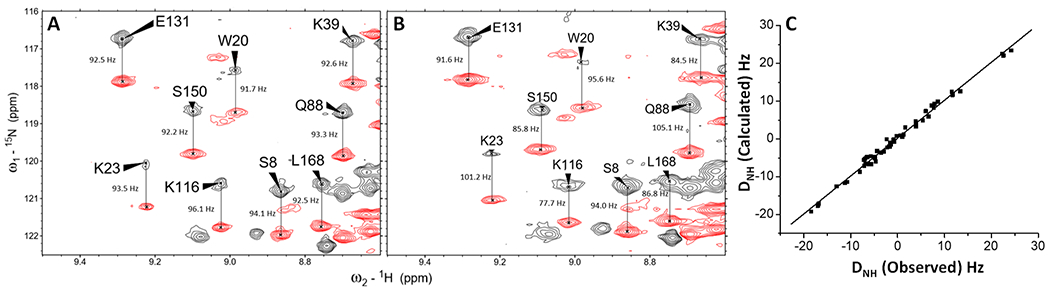
Fig. 2
Residual dipolar coupling (RDC) structural analysis of GCAP5. 1H–15N IPAP-HSQC spectra of Mg2+-bound GCAP5 in the (A) absence and (B) presence of 12 mg/mL Pf1 phage. Observed spectral splittings in the absence of Pf1 (JNH) and presence of Pf1 (JNH + DNH) are marked by vertical lines, and their difference was used to calculate RDCs as described in Materials and Methods. (C) RDCs calculated from the structure of Mg2+-bound GCAP5 in Figure 3 plotted vs the RDCs measured in panel B show good agreement (Q-factor = 0.27, and R-factor = 0.98532).
Acknowledgments
This image is the copyrighted work of the attributed author or publisher, and
ZFIN has permission only to display this image to its users.
Additional permissions should be obtained from the applicable author or publisher of the image.
Full text @ Biochemistry