FIGURE SUMMARY
Title

Grhl3 promotes retention of epidermal cells under endocytic stress to maintain epidermal architecture in zebrafish

Authors
Phatak, M., Kulkarni, S., Miles, L.B., Anjum, N., Dworkin, S., Sonawane, M.
Source
Full text @ PLoS Genet.

Regression of peridermal cell rounding phenotype occurs through reintegration of rounded cells.

DIC images of individual wild-type sibling (A, C, E, G, I) and gsp mutant (B, D, F, H, J) embryos imaged successively at 36, 48, 54, 60, and 72 hpf, respectively. A’–J’ represent the corresponding enlarged images of dorsal head epidermis. Arrowheads indicate regions showing cell rounding. Note that cell rounding increases until 48 hpf (progression) and decreases subsequently (recovery) to finally cease by 72 hpf. Confocal time lapse images of dorsal head epidermis of cldnB:lynEGFP embryos injected with myoVb splice site morpholino (myoVb MO) during the recovery period at 48 (K), 50 (L), 52 (M), and 54 (N) hpf along with respective orthogonal projections. All cell borders as well as several intracellular membrane compartments are marked by lynEGFP (green). White arrows represent reintegrated cells, showing progressive cell shape change from round to polygonal. Red arrow and white dotted outline indicate a rounded cell undergoing apical extrusion. Scale bar = 50 μm. Traces showing changes in cell circularity values (O) for ten randomly selected cells in the above movie. Red trace represents extruding cell. Dotted line represents cell circularity = 0.9, which was used as the benchmark for classifying cells as rounded. A table (P) showing total number of cells, number of rounded cells, apical extrusions and basal extrusions (delamination) in live confocal movies of myoVb morphant embryos made between 50-53hpf. The duration of the movie is indicated in parentheses.

Comparative transcriptomics analysis of <italic toggle='yes'>gsp</italic> and <italic toggle='yes'>rhs</italic> reveals upregulation of <italic toggle='yes'>grhl3</italic> and adhesion related genes.

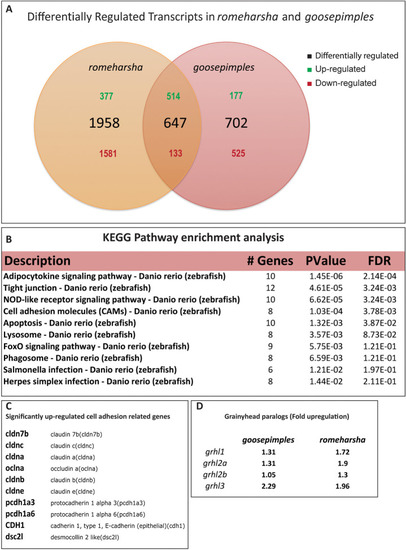
Venn diagram showing the numbers of differentially regulated transcripts in gsp and rhs (A). Pathway analysis of differentially regulated genes, common to both the genetic conditions, using KEGG pathways (B). Significantly upregulated cell-adhesion genes common to gsp and rhs (C). Fold upregulation of different grainyheadlike paralogs in gsp and rhs (D).

Whole mount RNA <italic toggle='yes'>in situ</italic> hybridization (WISH) reveals spatiotemporal association between cell rounding, <italic toggle='yes'>grhl3</italic> expression, and expression of cell adhesion genes.

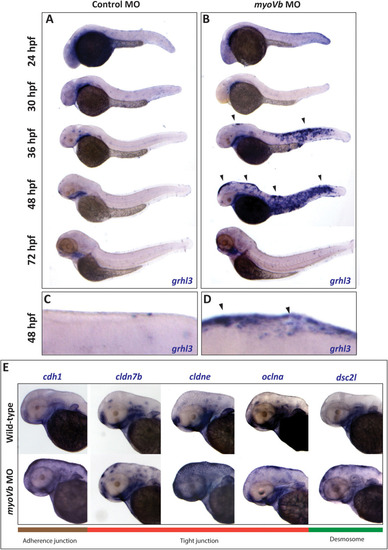
Bright field images of control morphant (A) and myoVb morphant (B) embryos at 24, 30, 36, 48, and 72 hpf stained for grhl3 transcripts. Zoomed in images of dorsal head epidermis of control morphant (C) and myoVb morphant embryos (D) stained for grhl3 expression at 48 hpf. The grhl3 expression was observed near the epidermal regions showing cell rounding (black arrowheads). WISH reveals increased expression of cell adhesion genes, cdh1, cldn7b, cldne, oclna, and dsc2l, in and around the epidermal regions containing rounded cells in myoVb morphants at 48 hpf (E).

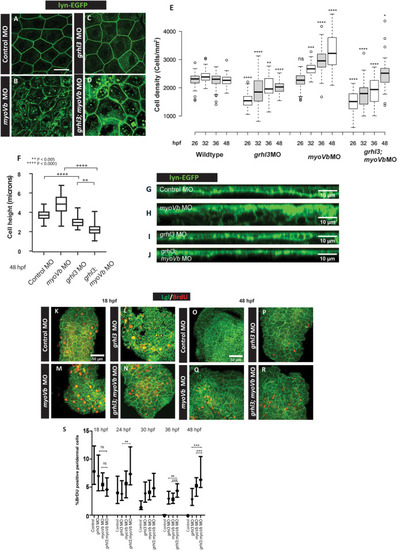
Bright field images of embryos at 28 hpf injected with control MO (A), myoVb MO (B), grhl3 MO (C), and grhl3 MO; myoVb MO (D). Black arrowheads indicate cell debris accumulated inside the chorion of grhl3 and grhl3;myoVb double morphant embryos, presumably due to epidermal cell shedding. Representative images of the head region of zebrafish larvae injected with control MO (E), myoVb MO (F), grhl3 MO (G), and grhl3;myoVb double morphant (H) at 36 hpf. Zoomed in images of the dorsal head region of myoVb morphant (I) and grhl3;myoVb double morphant (J) embryos, respectively. Representative images of wild-type siblings injected with control MO (K) and myoVb MO (L) and grhl3(-31/-31) mutants injected with control MO (M) and myoVb MO (N). Zoomed in images of dorsal head region of wild-type siblings (O) and grhl3 (-31/-31) mutants (P) injected with myoVb MO. Note the presence of rounded cells in myoVb MO in F, I, L, O—indicated by red arrowheads—and their absence in myoVb; grhl3 double deficient embryos in H, J, N, P. Representative confocal images of the peridermal cells from the stated genetic conditions at 48hpf (Q-T). Note the presence of rounded cells in myoVb MO indicated by red triangles. Box and whisker plot (U) showing quantitation of cell circularity in control, grhl3 MO, myoVb MO, and grhl3;myoVb MO at 48hpf. Each column represents cell circularities of 25 cells each from four embryos per condition (total 100). Grey dotted line represents the cell circularity threshold used for classifying round cells. Red numbers indicate % cells having cell circularity values above threshold. myoVb MO embryos show significantly higher median cell circularity than that in control and grhl3;myoVb MO (Kruskal Wallis One way ANOVA p<0.05). For all comparisons and statistical significance please refer to S2 Data.

A box and whisker plot (A) showing quantification of cell shedding by control morphant, grhl3 morphant, myoVb morphant, and grhl3;myoVb double morphant embryos during time windows: 12–18 hpf, 18–24 hpf, 24–30 hpf, and 30–36 hpf. Note that post 24 hpf, cell shedding in grhl3 morphants is comparable to that in myoVb morphants, whereas that in grhl3;myovb double morphants remains significantly higher (data presented as box plots showing median and IQR, n = 20, N = 5, one-way ANOVA, p<0.0001). Quantification of peridermal rosette structures in the dorsal head region. Box and whisker plot shows rosette densities (rosettes/mm2) at various developmental stages (B). Numbers in red indicate % embryos showing rosettes. Median rosette density is comparable at 26 hpf in all conditions. However, at 32 hpf, 36 hpf and 48 hpf, grhl3;myoVb morphants show significantly higher rosette density and occurrence than those in either grhl3 or myoVb morphants. Statistical significance was calculated using Kruskal Wallis one-way ANOVA with Dunn’s post hoc test. Representative confocal images (B’) showing rosettes indicated by yellow arrowheads in stated genetic conditions. Confocal images of dorsal head periderm showing clones injected with control MO, myoVb MO, grhl3 MO, and grhl3+myoVb MO and marked by GFP (green) and stained for E-cadherin (red) at 48 hpf (C, D, E, F). Scale bar = 50 μm. The percentage of embryos showing peridermal clones was calculated as readout of cell retention probability in the periderm. The dot plot shows quantification of clone retention at 12 hpf and 48 hpf (G); individual points represent % embryos showing peridermal clones in a set, horizontal line denotes median. n ~ 60, N = 3. Note that grhl3 and grhl3;myoVb double morphant clones show lower retention compared to those of control morphant or myoVb morphant clones at 48 hpf. Square brackets (in A and B) indicate comparisons and asterisks represent statistically significant difference. Only relevant comparisons in A and B are shown. For all comparisons and statistical significance please refer to S2 Data.

Cell loss due to Grhl3 deficiency leads to altered tissue architecture and homeostasis.

Representative confocal images of cldnB:lynEGFP embryos (A-D), injected with control MO, myoVb MO, grhl3 MO, and grhl3 MO; myoVb MO. Peridermal cell density (cells/mm2) at different time-points in given genetic conditions (E). Note that grhl3 morphants as well as grhl3;myoVb morphants show lower cell density than wildtype at 26 hpf. However, their cell densities approach wild-type levels by 48 hpf. In myoVb morphants, cell density increases over time and is significantly higher than that in wild-type. Scale bar = 50 μm. Asterisks indicate statistically significant difference between the wild type and the given genetic condition at a comparable time-point by Kruskal Wallis one-way ANOVA followed by Dunn’s post-hoc test. Quantification of cell height (F) of peridermal cells at 48 hpf in four genetic conditions mentioned. grhl3 morphants and grhl3;myoVb double morphants show significantly reduced cell heights compared to those in control morphants and myoVb morphants, respectively (Kruskal Wallis one-way ANOVA, p<0.05). Orthogonal projections of confocal-scans showing cross-sectional view of periderm (G, H, I, J). Confocal micrographs of embryonic epidermis immunostained for Lgl/BrdU (K-R) at 18hpf (K-N) and 48hpf (O-R). Quantification of cell proliferation in the periderm at 18hpf, 4hpf, 30hpf,36hpf, and 48hpf in four genetic conditions (S). (All data presented as box plot showing median and IQR, One-way ANOVA with Tukey’s test, p < 0.05). In E, F and S square brackets denote comparisons while asterisks indicate statistically significant difference. Only relevant comparisons are shown. For all one-to-one comparisons, please refer to S2 Data.

E-cadherin expression in MyoVb deficient epidermis is <italic toggle='yes'>grhl3</italic>-dependent and cell autonomously sufficient for cell retention.

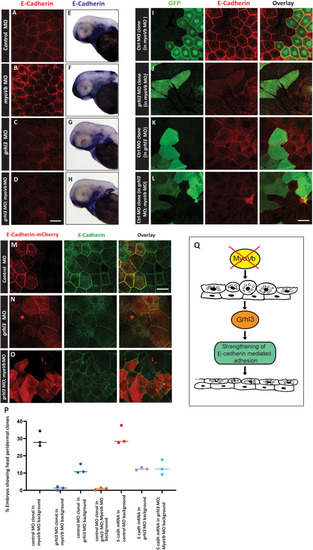
Representative confocal images of dorsal head periderm of control (A), myoVb MO (B), grhl3 MO (C), grhl3 MO;myoVb MO (D) at 48 hpf, stained with anti-E-cadherin antibody (red). Scale bar in D (for A-D) = 50 μm. Increased localization of E-cadherin in myoVb morphants is absent in grhl3;myoVb double morphants. Representative bright field images showing expression of cdh1 (E-cadherin) by WISH in the above four conditions (E-H). Note the increased patchy expression of cdh1 adjacent to regions having cell rounding in myoVb morphants, which is absent in grhl3;myoVb double morphants. Assessment of retention probability of Grhl3 deficient cells in MyoVb deficient periderm. Control (I) and grhl3 morphant clones (J) in myoVb morphant embryonic epidermis (I, J), control morphant clones (K,L) in grhl3 morphant (K) and grhl3;myoVb double morphant epidermis (L). Clones are marked with GFP (green). Anti-E-cadherin staining marks cell boundaries (red). Confocal images of peridermal clones overexpressing Cdh1-mCherry (red) in control (M), grhl3 morphant (N) and grhl3;MyoVb double morphant (O) epidermis. All cell boundaries are marked by anti-E-cadherin antibody (green). Scale bar in L, M = 50 μm. Graph representing proportion of embryos retaining the clones under given genetic conditions (P). % embryos showing peridermal clones per set are plotted as individual points, horizontal line denotes the median value. Note that grhl3 morphant clones are retained rarely in myoVb morphant epidermis. While clones retention is very low in grhl3;myoVb double morphant embryos, cdh1 overexpression partially rescues this phenotype. A schematic (Q) showing Grhl3 functioning in retention of rounded cells by strengthening E-cadherin mediated cell-cell adhesion.

Acknowledgments
This image is the copyrighted work of the attributed author or publisher, and ZFIN has permission only to display this image to its users. Additional permissions should be obtained from the applicable author or publisher of the image. Full text @ PLoS Genet.