
- Title
-
Ganglion cells in larval zebrafish retina integrate inputs from multiple cone types
- Authors
- Connaughton, V.P., Nelson, R.F.
- Source
- Full text @ J. Neurophysiol.
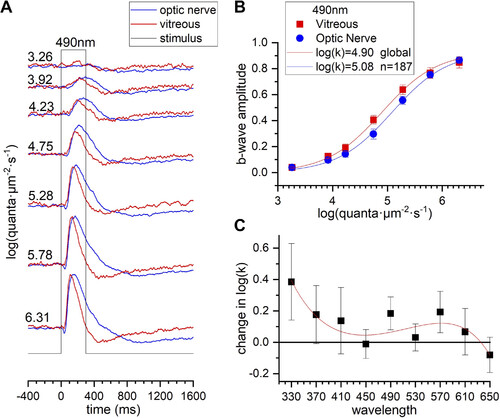
Absorption of spectral stimuli by larval sclera, choroid, and pigment epithelium. Electroretinogram (ERG) b wave sensitivity is used to estimate stimulus attenuation with transscleral stimuli. A: recordings within the optic nerve, using transscleral stimulation (blue), and within the vitreous, using corneal stimulation (red), are normalized to the maximal amplitude at each recording configuration and superimposed. The quantal irradiance, given on left of each response trace in log(quanta·µm−2·s−1), is calibrated at the eye surface. B: maximum-amplitude-normalized data sets at 490 nm for 8 vitreal and 21 optic nerve b wave data sets are combined and globally fit by Hill functions. The semisaturation irradiance k is fit separately, but the saturation amplitude Vm and exponent n are constrained to be the same. Overall, vitreal b waves were 0.18 log units more sensitive than optic nerve b waves at 490 nm. C: the change in log(k) across stimulus wavelengths is fit by a 4th-order polynomial. In B and C error bars are SEs. |
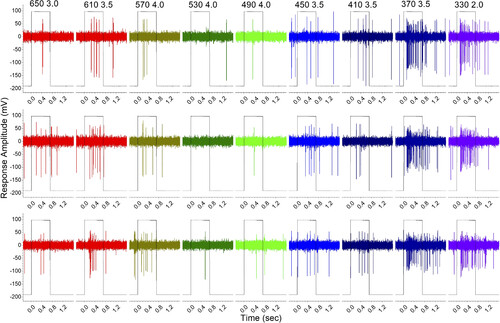
Spectral response data set for C6 stimulus protocol. This 5 days postfertilization (dpf) ganglion cell is most sensitive to long (610 nm)- and short (370–330 nm)-wavelength stimuli, while appearing inhibited in the midspectrum (530–490 nm). The spikes are shown after 200-Hz high-pass filtering and Savitsky–Golay smoothing (10 points, 1 ms, order 3). The rectangular traces indicate light stimulation. The column headers give the wavelength and log of neutral-density attenuation of the beam used in the C6 stimulus protocol. The modeling of this data set appears in Fig. 4. |
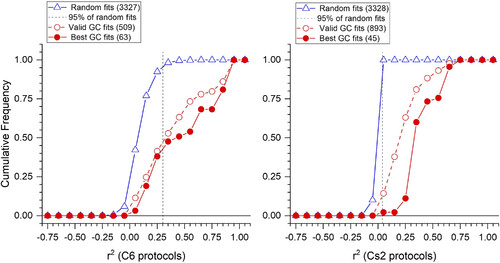
Discriminating cone signals from noise. For both C6 (27 stimuli, left) and Cs2 (280 stimuli, right) protocols, 26 random impulse data sets were generated and fit to the set of 127 models that test all combinations of 7 cones. The cumulative frequencies of resultant r2 values (blue open triangles) are compared to values for “valid” spectral models of ganglion cell (GC) data sets (valid GC fits, open red circles) and to the “best” r2 values for each GC. Models with all cone Vmax values significantly different from “0” are “valid” models (t test). “Best” models are those with the greatest r2 value and those with r2 values indistinguishable from the best value [best GC fits, filled red circles (F tests, P ≥ 0.95)]. Ninety-five percent of random fits lie to the left of the dashed vertical lines. Only fits of GC data sets to the right of this line are considered to be candidate GC models. |
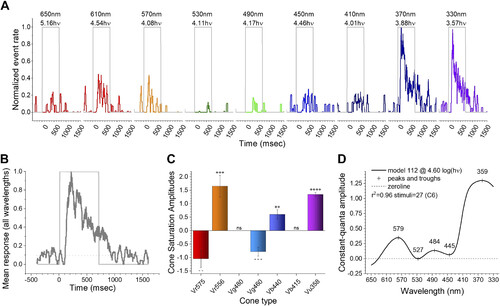
Fitting the sample C6 impulse data to a spectral model. A: impulse events (shown in Fig. 2) are detected, and the running averages of events in a 50-ms time bin are displayed as normalized event rates. Wavelengths are color coded and shown above each stimulus trace. The number below each wavelength is the irradiance in log(quanta·µm−2·s−1) (where hν = quanta). C6 stimulus protocol. B: the mean waveform for all 9 wavelengths shows increased activity throughout the 700-ms stimulus. C: the best-fitting model (112) uses 5 cone signals to represent the data set. + and − indicate significance of excitatory or inhibitory signals. respectively, with the number of symbols representing t test significance (GraphPad convention). D: event-rate amplitudes for constant quantal stimulation across wavelengths [log(quanta·µm−2·s−1) = 4.60] for the best-fitting model (112). No other model had a comparable residual variance (F test, P ≥ 0.95). |
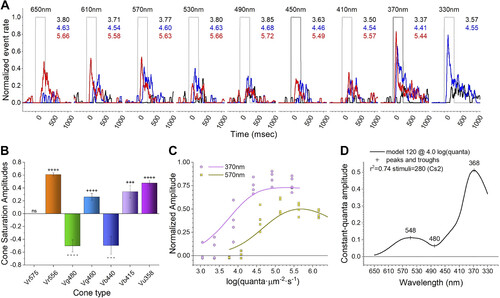
Fitting a Cs2 data set to a model. A: for clarity, response traces to only 3 of the 7 irradiances presented at each wavelength in the Cs2 protocol are shown. These are equal quantal across all wavelengths. The responses are color coded, with black being the dimmest, blue intermediate, and red the brightest. Numbers on right of the stimulus traces give the irradiances in log(quanta·µm−2·s−1). B: the best-fitting model (120) uses 6 of the 7 cones, 4 excitatory (R2, G1, B1, and UV) and 2 inhibitory (G3 and B2). No other indistinguishable models (F test, P ≥ 0.95) were found. +++, ++++ and − − −, − − − − (P ≤ 0.001, P ≤ 0.0001) are t test probability codes for excitatory and inhibitory signal amplitudes, respectively. ns, Nonsignificant. C: model 120 fits to Cs2 irradiance response data at 2 wavelengths (370 nm and 570 nm). D: model 120 interpolates response amplitudes across the spectrum for constant quantal stimulation at 4.00 log(quanta·µm−2·s−1). |
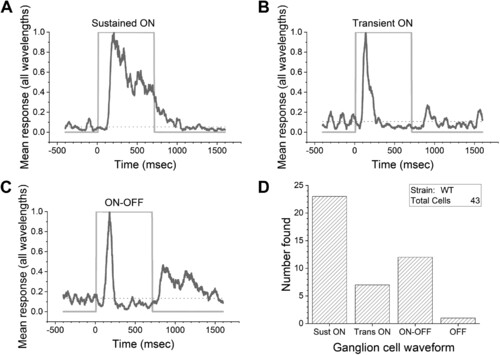
Light evokes different discharge kinetics in larval ganglion cells. A–C: mean firing rate waveforms are generated from all wavelengths and irradiances in C6 (27 stimuli) spectral protocols. These are subjective groupings of impulse-discharge kinetics. A: sustained-ON. The impulse discharge is elevated throughout the light step. B: transient-ON. The impulse discharge is complete within 300 ms and is followed by maintained suppression of activity for the remainder of the light pulse. C: ON-OFF. Separate discharge peaks occur at stimulus onset and offset. Inhibition appears during the later phase of stimulation. The ON-OFF dynamic may either be wavelength independent or arise from color opponency. D: frequency of occurrence of the sustained-ON, transient-ON, ON-OFF, and OFF temporal patterns. Purely OFF responses are rare under these stimulus conditions. WT, wild type. |
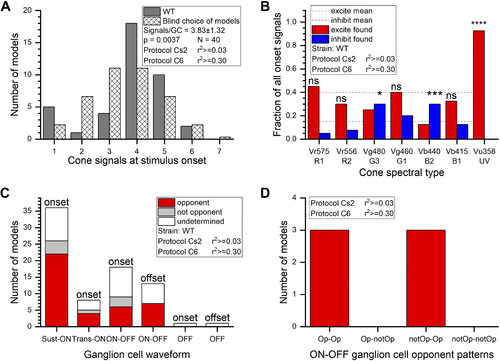
Cone input patterns in onset responses. A: the number of cone signals found for ON responses in “best” ganglion cell (GC) models varied from 1 to 6, with a peaked distribution centered at 3.8 (dark bars). The distribution differed from blind choices among the 127 models [hatched bars, χ2(6,40) = 19.27, P ≤ 0.01]. Models are numbered from 1 to 127, with the group of single-cone models on left and the single-membered 7-cone group on right. The “blind” choice distribution is proportional to the number of models in each group. B: overall patterns of excitation and inhibition found at stimulus onset differed among spectral types of cone. The fraction of excitatory (red) or inhibitory (blue) signals found for the 40 “best” onset models is illustrated for each cone type. For all cones, the fraction of modeled excitation was 0.40 (dashed red line). The fraction of modeled inhibition was 0.15 (dashed blue line). The significance of the ways individual cone types differed from these overall means is indicated by asterisks (χ2 tests, see text). Vu358 (UV) cone signals were significantly different, being 93% excitatory, whereas Vg480 (G3) green cones and Vb440 (B2) blue cones favored inhibition. C: in sustained-ON (Sust-ON), transient-ON (Trans-ON), and ON-OFF GC types, modeled opponency was the most common pattern, and nonopponency was rare. “Undetermined” models are those that did not meet the criterion r2 values. D: for ON-OFF GCs where opponency could be determined for both ON and OFF signals, it was common that both phases were color opponent, but the type of opponency, or nonopponency, differed. WT, wild type. |
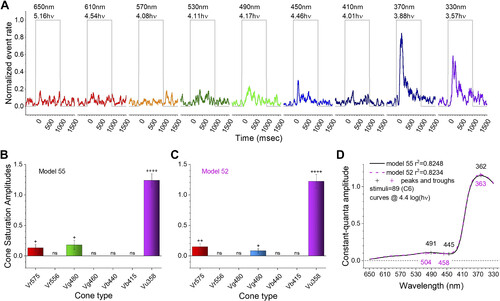
Excitation patterns in a nonopponent, trichromatic ganglion cell (GC). A: UV stimuli (370 nm) evoke maximal spike rates. Wavelengths are color coded and shown above each stimulus trace. The number below each wavelength is the irradiance in log(quanta·µm−2·s−1) (where hν = quanta). B: the best model was model 55, showing high-amplitude and very significant excitation from UV cones (Vu358) and less significant, lower-amplitude excitation from R1 and G3 cones (Vr575 and Vg480). C: although the r2 value of model 52 was less than model 55, the residual variance was indistinguishable (F test). In model 52, G1 cone excitation substitutes for G3 excitation. Both models 55 and 52 are trichromatic and, lacking inhibition, nonopponent. In B and C, saturation amplitudes for cone signals are given as a fraction of the maximum light-evoked spike-discharge in the data set. ++++, ++, and + give significance of excitatory signals (GraphPad convention). D: the fractional light-evoked discharge amplitudes for model 55 (black line) and model 52 (magenta line) at constant-quantal [4.4 log(quanta·µm−2·s−1)] stimulation across the wavelength spectrum are nearly identical, as are the spectral peaks and troughs (+symbols). Four C6 data sets from a single GC are combined. |
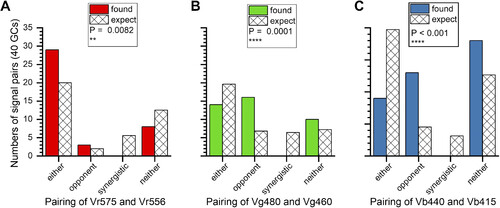
Selective association among cone pairs. In a 7-cone scheme there are 21 unique pairs. Three of these showed association patterns that differed from what would be expected. The expectation value is based on nonpreferential pairing according to the frequency that cone-type excitation or inhibition were found in the overall population of ganglion cells (GCs). Selective associations were R1-R2 (Vr575 and Vr556) (A), G1-G3 (Vg460 and Vg480) (B), and B1-B2 (Vb440 and Vb415) (C). No pairing of dual excitatory or dual inhibitory signals (synergistic) were found in any of these pairs, and excitatory-inhibitory pairing (opponent) exceeded expectation values. The probabilities of these distributions (P) are calculated from χ2 tests (df = 3, n = 40). Both best-fit models and models indistinguishable from best fit are counted. |
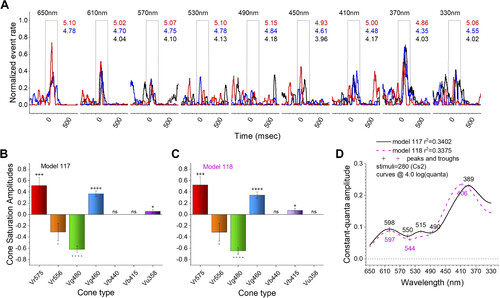
Transient-ON spectral patterns in an opponent ganglion cell (GC). A: red (650 nm, 610 nm) and UV (370 nm) stimuli evoked maximal spike rates in response to the Cs2 spectral protocol. Wavelengths appear above each nested set of 3 spike-rate discharge records, which are in response to different irradiances. The irradiances are selected from 7 total to give matching irradiances at each wavelength. These are equal quantal responses. The quantal brightness is given in log(hν·µm−2·s−1) to the right of each stimulus trace, with black corresponding to the dimmest, red to the brightest, and blue intermediate. B: model 117 fit the full, 280-point, GC data set best. R1 (Vr575), G1 (Vg460), and UV (Vu358) were modeled as excitatory and R2 (Vr556) and G3 (Vg480) as inhibitory. + and − signify excitation and inhibition, respectively, with the number of each symbol denoting the level of significance (as in Figs. 4 and 5). ns, Not significant. C: the residual variance for model 118 was indistinguishable from model 117 (F117,118 = 0.996, P = 0.97). Both models are pentachromatic and color opponent. Model 118 differs from model 117 only in the substitution of B1 excitation (Vb415) for UV excitation (Vu358). D: constant-quantal spectral curves for models 117 and 118. The curves are similar in shape and in peak and trough positions. |

ON-OFF opponent ganglion cell spectral patterns. A: in this cell both ON and OFF discharges are prominent particularly with UV excitation (370 nm, 330 nm). At long wavelengths (650 nm, 610 nm, 570 nm) only an OFF discharge is apparent (at ∼500 ms), with a suggestion of impulse silencing during stimulation. Wavelengths appear above each nested set of 3 spike-rate discharge records, which are in response to dim, intermediate, and bright irradiances. The irradiances, selected from 7 total at each wavelength, are matched for comparable quantal stimulation. These are equal quantal responses across wavelengths. The quantal brightness of each monochromatic stimulus is given in log(hν·µm−2·s−1) on left of each stimulus trace. B: mean response waveforms for all stimuli at long (650–570 nm), middle (530–490 nm), and short (370–330 nm) wavelengths. At middle wavelengths there is discharge quieting, at long wavelengths an OFF response, and at short wavelength an ON-OFF pattern. ON (C) and OFF (C′) responses are fit by different spectral models, both opponent but employing different numbers of cone opsin signals. All onset model cone signals are included in the offset model, but further cone signals are added. + and − are the probabilities of nonzero excitatory and inhibitory cone opsin signals, following the GraphPad convention for significance (t tests). Modeled discharge amplitude spectra for constant quantal irradiances at ON (D) and OFF (D′): the response onset model (model 36) is trichromatic but generates 4 spectral phases. Long-wavelength excitation is absent. The offset model (model 125) is hexachromatic and pentaphasic. The stimulus protocol is Cs2 (280 stimuli). |