
|
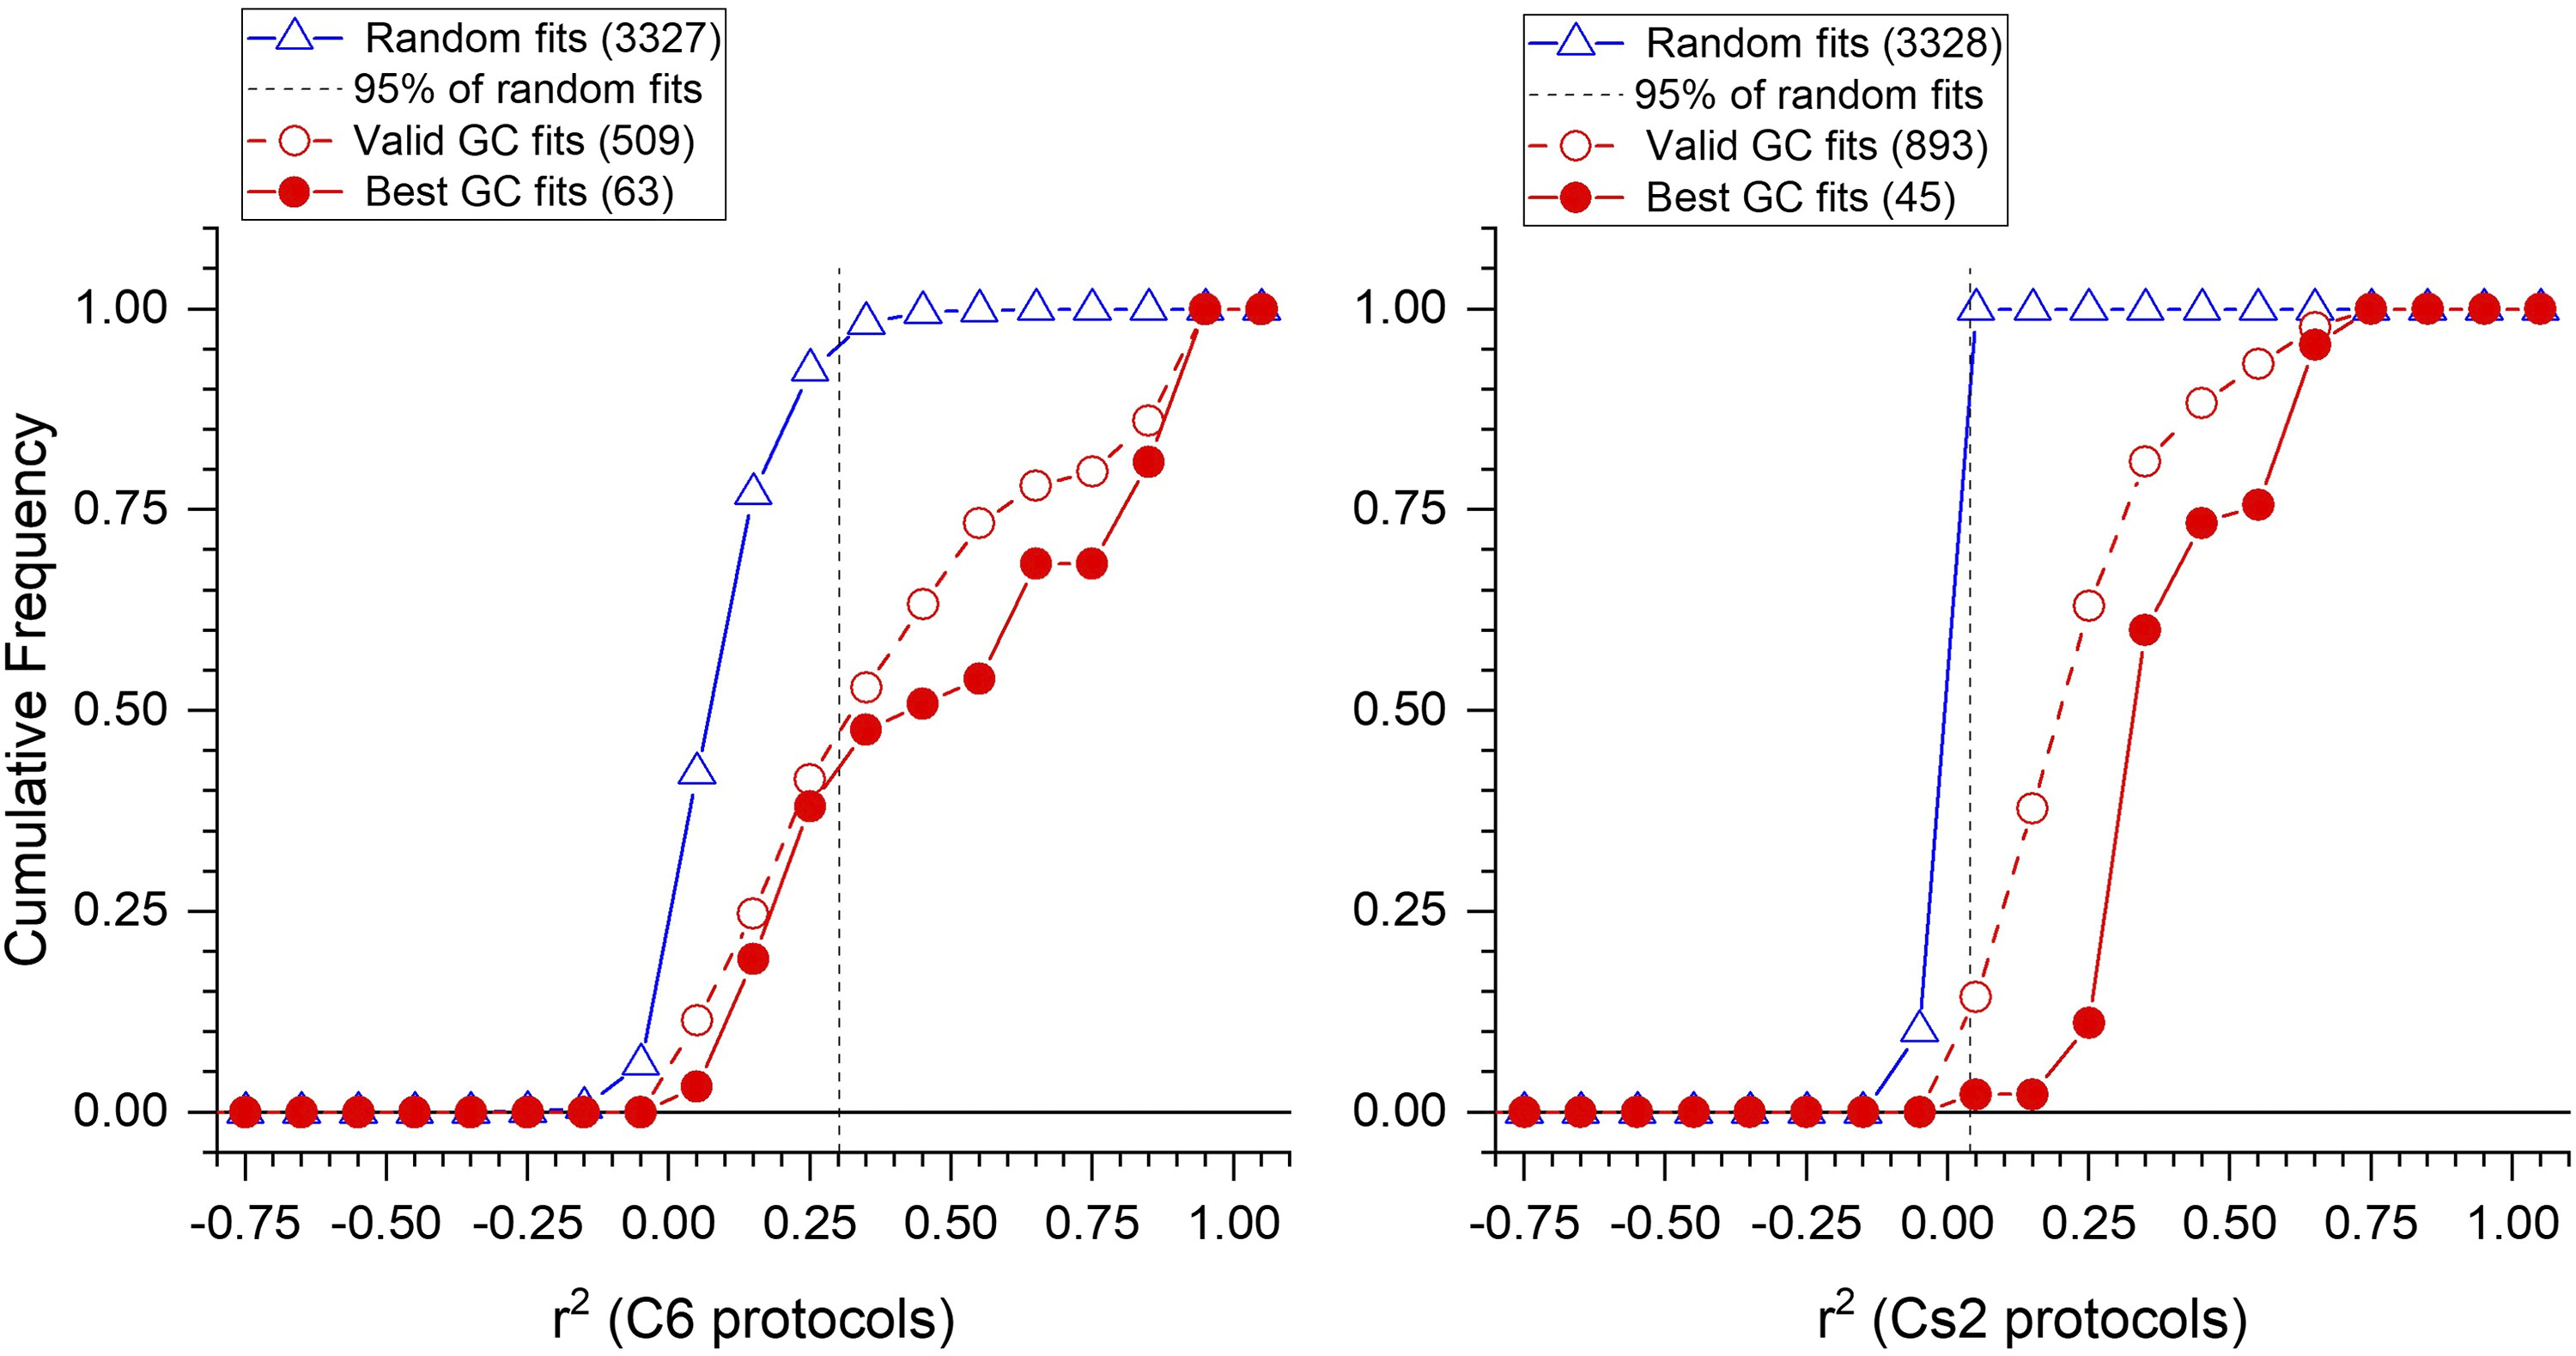
Fig. 3 Discriminating cone signals from noise. For both C6 (27 stimuli, left) and Cs2 (280 stimuli, right) protocols, 26 random impulse data sets were generated and fit to the set of 127 models that test all combinations of 7 cones. The cumulative frequencies of resultant r2 values (blue open triangles) are compared to values for “valid” spectral models of ganglion cell (GC) data sets (valid GC fits, open red circles) and to the “best” r2 values for each GC. Models with all cone Vmax values significantly different from “0” are “valid” models (t test). “Best” models are those with the greatest r2 value and those with r2 values indistinguishable from the best value [best GC fits, filled red circles (F tests, P ≥ 0.95)]. Ninety-five percent of random fits lie to the left of the dashed vertical lines. Only fits of GC data sets to the right of this line are considered to be candidate GC models.