
|
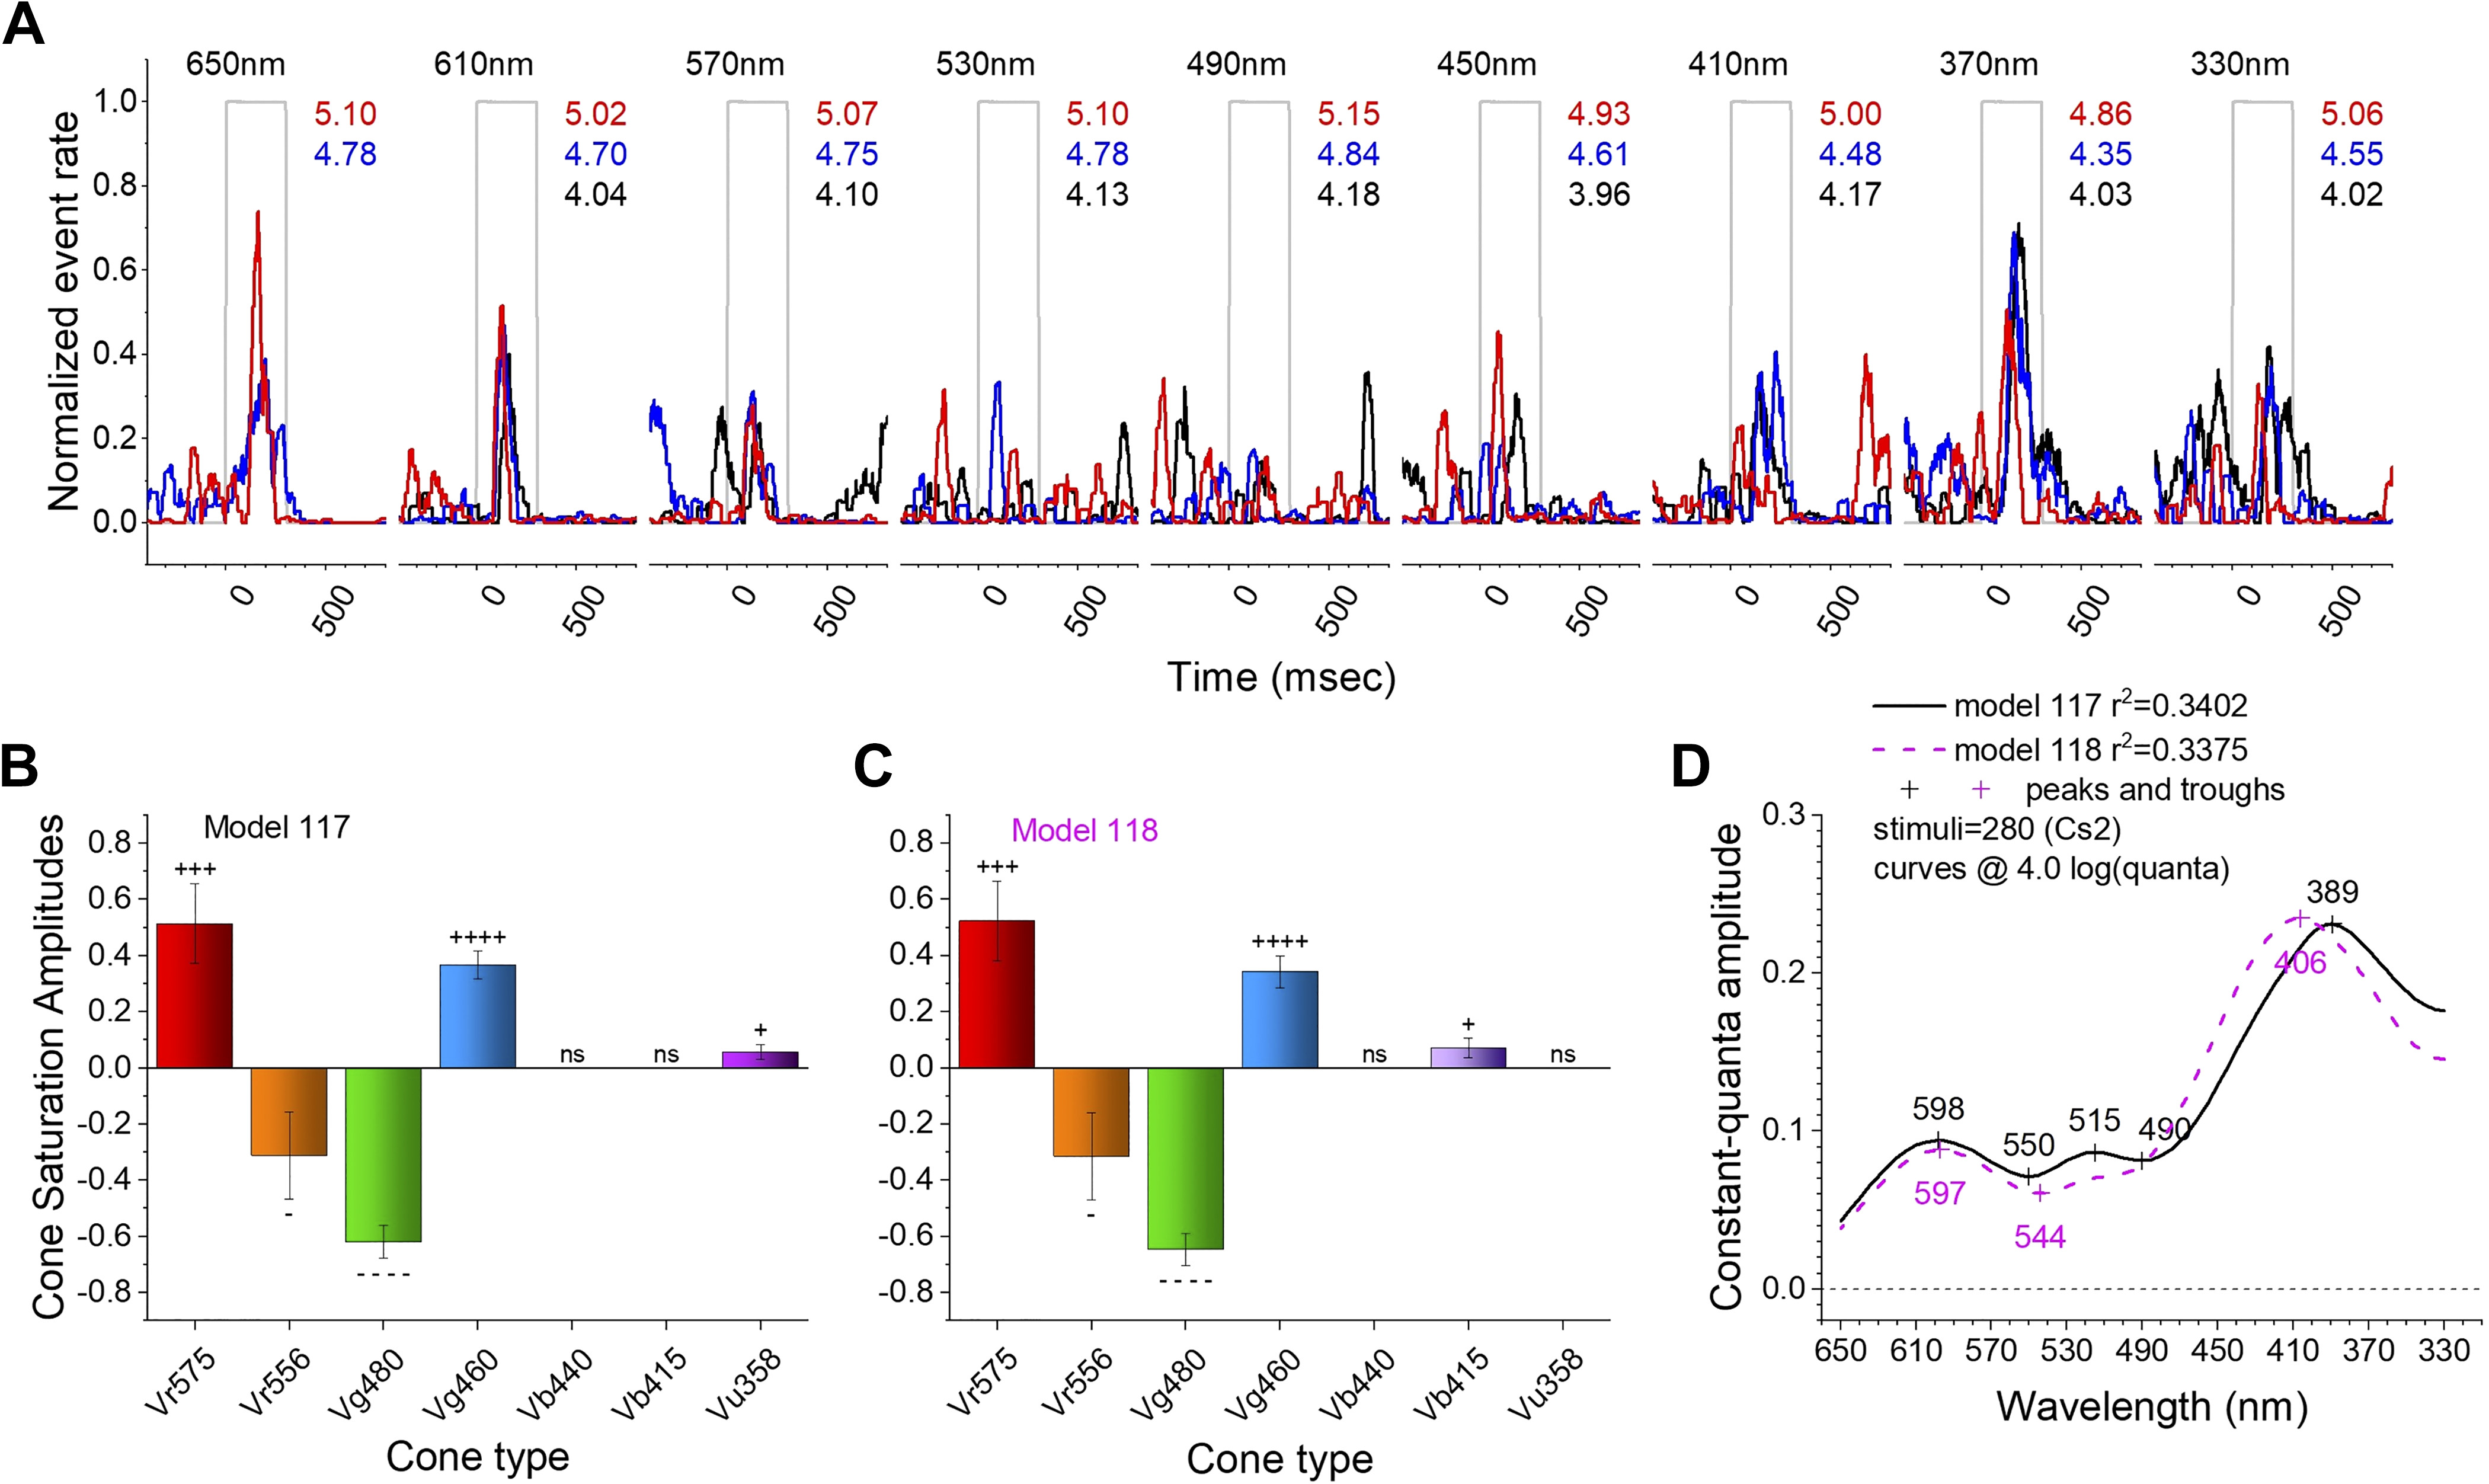
Fig. 10 Transient-ON spectral patterns in an opponent ganglion cell (GC). A: red (650 nm, 610 nm) and UV (370 nm) stimuli evoked maximal spike rates in response to the Cs2 spectral protocol. Wavelengths appear above each nested set of 3 spike-rate discharge records, which are in response to different irradiances. The irradiances are selected from 7 total to give matching irradiances at each wavelength. These are equal quantal responses. The quantal brightness is given in log(hν·µm−2·s−1) to the right of each stimulus trace, with black corresponding to the dimmest, red to the brightest, and blue intermediate. B: model 117 fit the full, 280-point, GC data set best. R1 (Vr575), G1 (Vg460), and UV (Vu358) were modeled as excitatory and R2 (Vr556) and G3 (Vg480) as inhibitory. + and − signify excitation and inhibition, respectively, with the number of each symbol denoting the level of significance (as in Figs. 4 and 5). ns, Not significant. C: the residual variance for model 118 was indistinguishable from model 117 (F117,118 = 0.996, P = 0.97). Both models are pentachromatic and color opponent. Model 118 differs from model 117 only in the substitution of B1 excitation (Vb415) for UV excitation (Vu358). D: constant-quantal spectral curves for models 117 and 118. The curves are similar in shape and in peak and trough positions.