
|
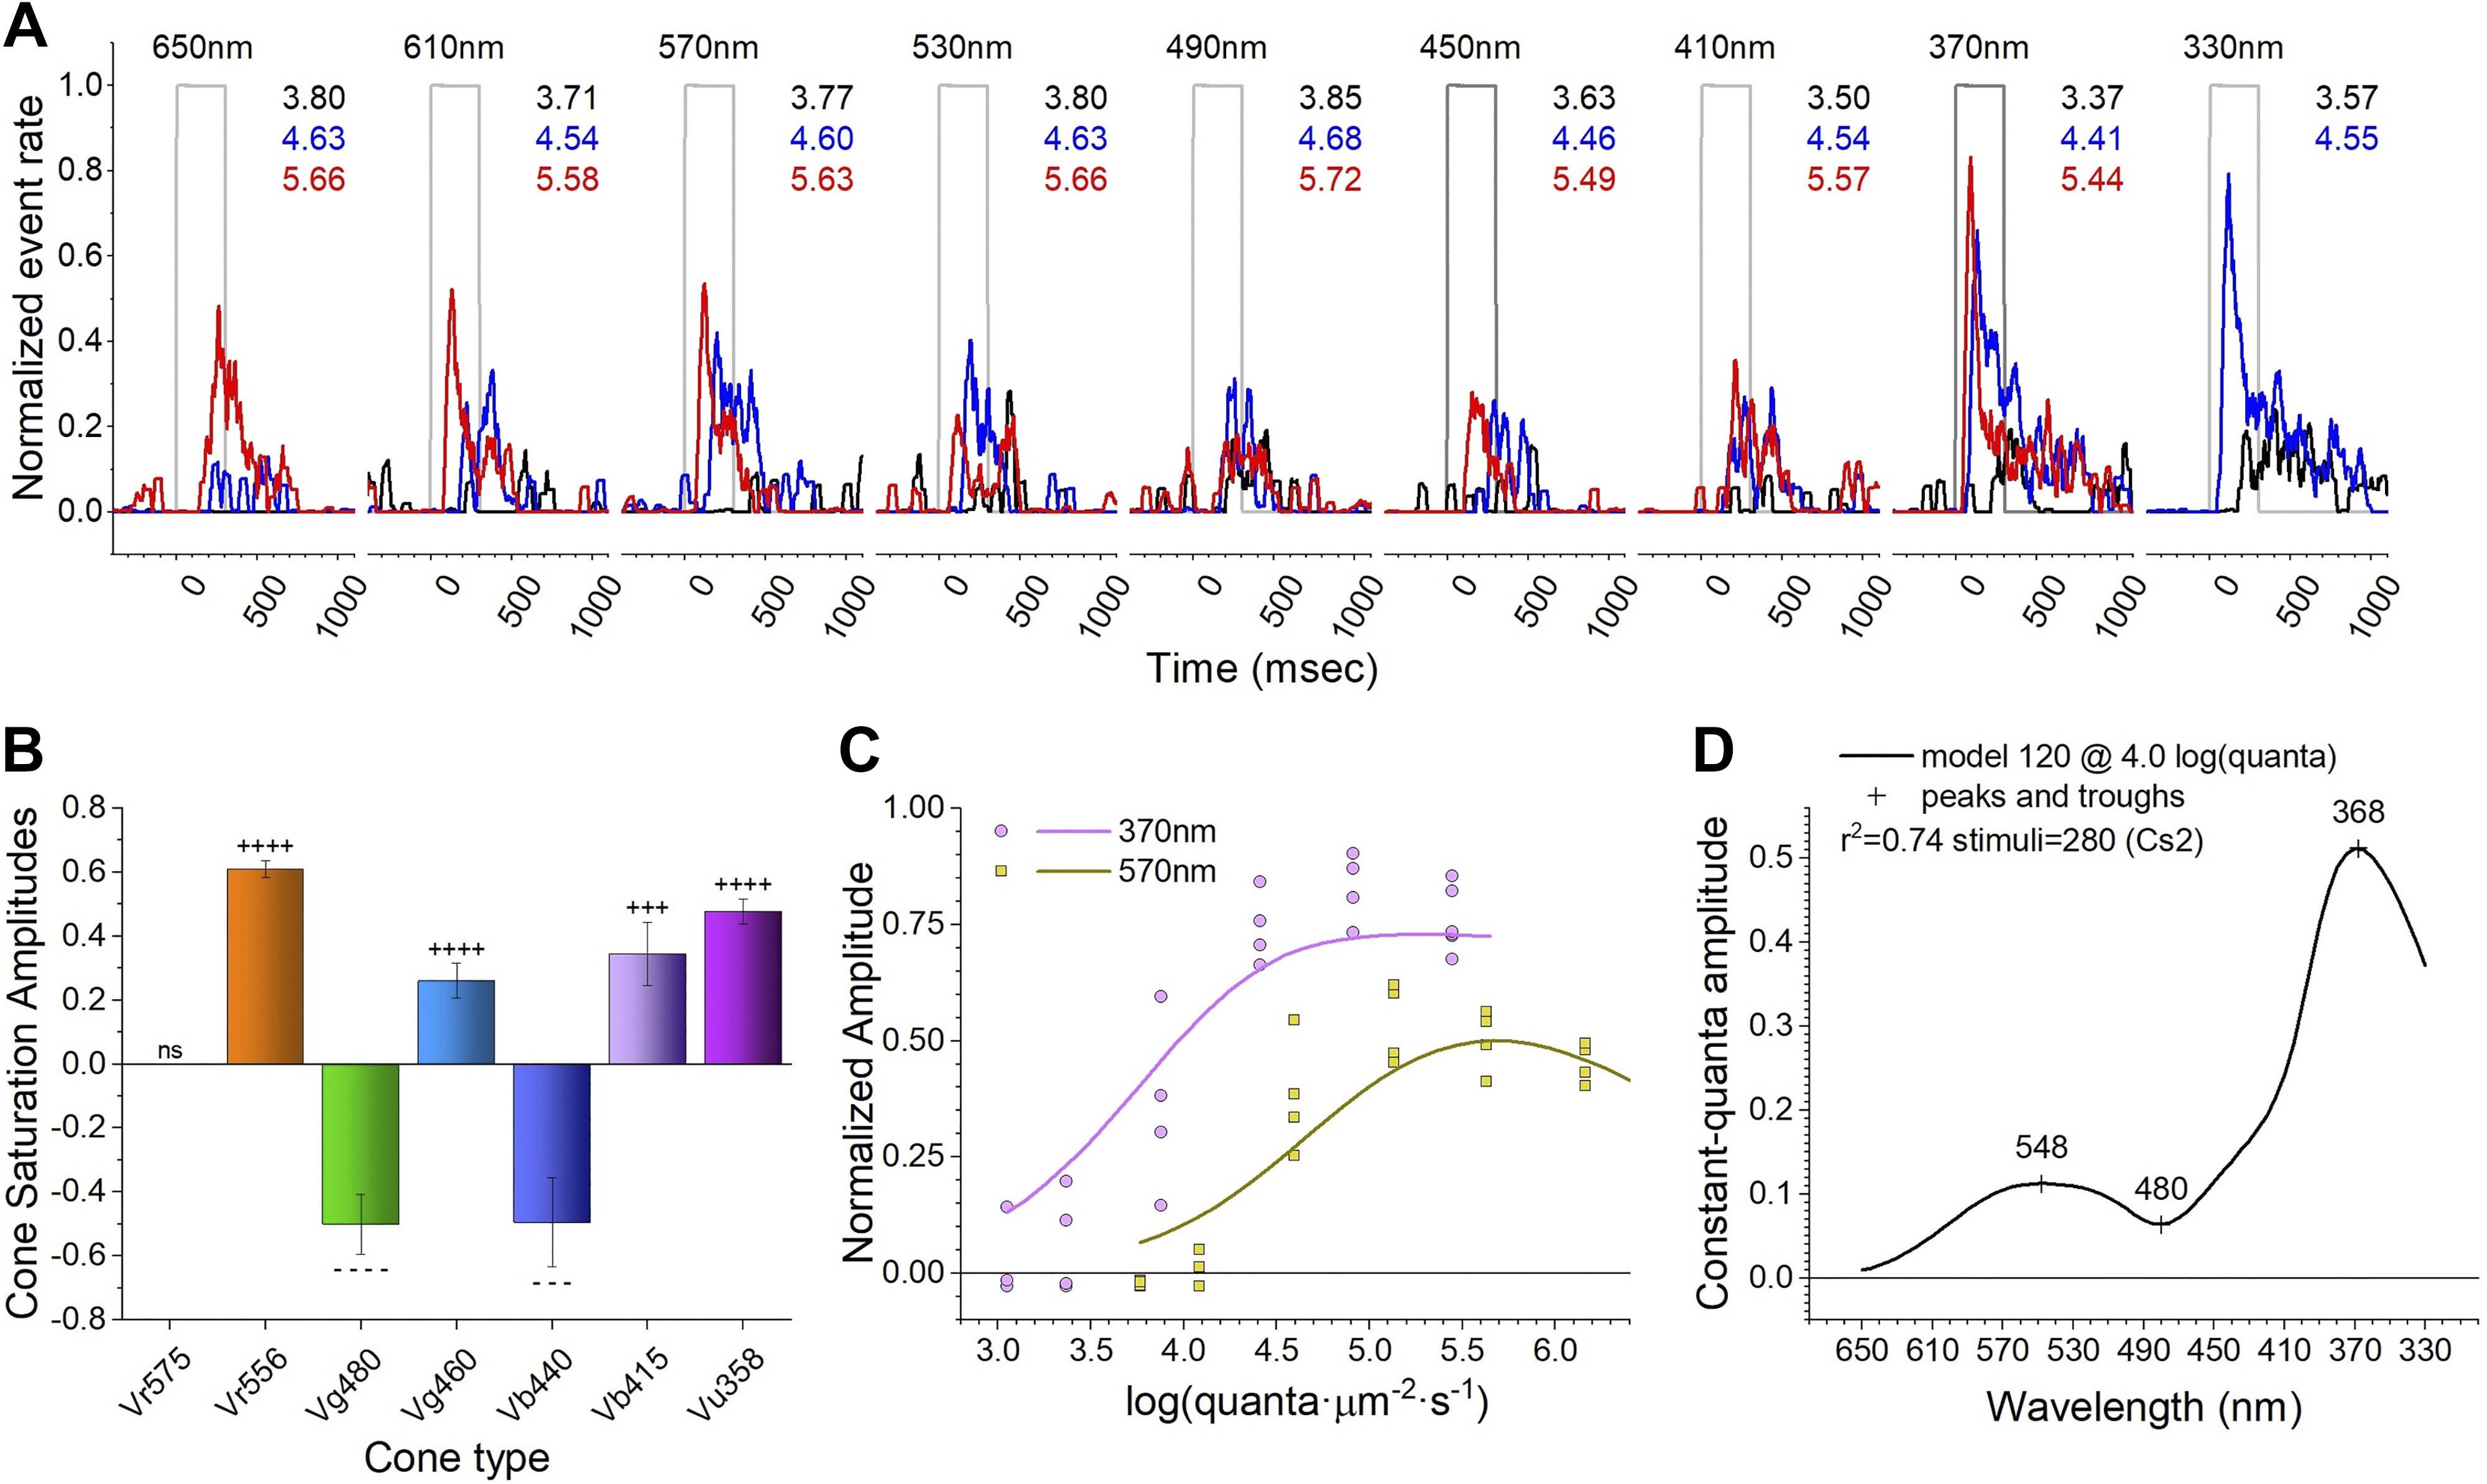
Fig. 5 Fitting a Cs2 data set to a model. A: for clarity, response traces to only 3 of the 7 irradiances presented at each wavelength in the Cs2 protocol are shown. These are equal quantal across all wavelengths. The responses are color coded, with black being the dimmest, blue intermediate, and red the brightest. Numbers on right of the stimulus traces give the irradiances in log(quanta·µm−2·s−1). B: the best-fitting model (120) uses 6 of the 7 cones, 4 excitatory (R2, G1, B1, and UV) and 2 inhibitory (G3 and B2). No other indistinguishable models (F test, P ≥ 0.95) were found. +++, ++++ and − − −, − − − − (P ≤ 0.001, P ≤ 0.0001) are t test probability codes for excitatory and inhibitory signal amplitudes, respectively. ns, Nonsignificant. C: model 120 fits to Cs2 irradiance response data at 2 wavelengths (370 nm and 570 nm). D: model 120 interpolates response amplitudes across the spectrum for constant quantal stimulation at 4.00 log(quanta·µm−2·s−1).