
Fig. 8
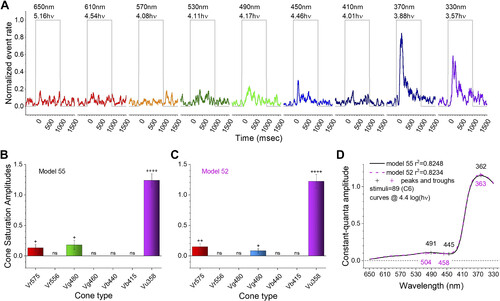
Excitation patterns in a nonopponent, trichromatic ganglion cell (GC). A: UV stimuli (370 nm) evoke maximal spike rates. Wavelengths are color coded and shown above each stimulus trace. The number below each wavelength is the irradiance in log(quanta·µm−2·s−1) (where hν = quanta). B: the best model was model 55, showing high-amplitude and very significant excitation from UV cones (Vu358) and less significant, lower-amplitude excitation from R1 and G3 cones (Vr575 and Vg480). C: although the r2 value of model 52 was less than model 55, the residual variance was indistinguishable (F test). In model 52, G1 cone excitation substitutes for G3 excitation. Both models 55 and 52 are trichromatic and, lacking inhibition, nonopponent. In B and C, saturation amplitudes for cone signals are given as a fraction of the maximum light-evoked spike-discharge in the data set. ++++, ++, and + give significance of excitatory signals (GraphPad convention). D: the fractional light-evoked discharge amplitudes for model 55 (black line) and model 52 (magenta line) at constant-quantal [4.4 log(quanta·µm−2·s−1)] stimulation across the wavelength spectrum are nearly identical, as are the spectral peaks and troughs (+symbols). Four C6 data sets from a single GC are combined. |