
- Title
-
Trans-inhibition of axon terminals underlies competition in the habenulo-interpeduncular pathway
- Authors
- Zaupa, M., Naini, S.M.A., Younes, M.A., Bullier, E., Duboué, E.R., Le Corronc, H., Soula, H., Wolf, S., Candelier, R., Legendre, P., Halpern, M.E., Mangin, J.M., Hong, E.
- Source
- Full text @ Curr. Biol.
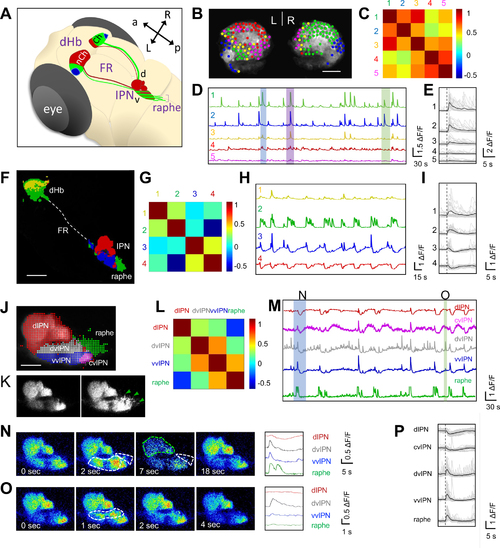
Identification of functional domains in dHb-IPN pathway during spontaneous activity
(A) Schematic of dHb-IPN pathway of larval zebrafish. Non-cholinergic (nCh, red) neurons are mainly in the left dHb and project to the dorsal IPN (d) whereas cholinergic (Ch, green) neurons are largely in the right dHb and project to the ventral IPN (v) and raphe (bracket). Somatostatinergic neurons are depicted in blue. Anterior (a), posterior (p), left (L) and right (R). (B, F, J) Representative 6 day post fertilization (dpf) Tg(gng8:GAL4ff)c426;Tg(UAS:GCaMP7a) brain explants expressing GCaMP in dHb neurons (B), left dHb and their terminals (F) and terminals at the IPN and raphe (J), overlaid by colored circles representing functional domains identified by k-means clustering. Dotted line depicts the fasciculus retroflexus (FR) in (F). (C, G, L) Correlation matrix of average ΔF/F signals between different clusters of dHb soma (C), dHb soma and terminals (G) and terminals at the IPN and raphe (L). (D, H, M) Average ΔF/F traces from each cluster in 10-minute recordings. Colored boxed events in (D) correspond to single frame images in Figure S1. (E, I, P) Average ΔF/F traces (black) of individual calcium events (grey). (E) Traces of green/blue neurons exhibiting synchronized activity. n = 6 explants, 29 events. See Video S1. (I) Traces of calcium bursts in the ventral dHb and dHb terminals at the vIPN and raphe (green, blue). Note that dHb terminals at the dIPN exhibit inhibition (trace 4). n = 5 explants, 24 events. See Video S2. (P) Traces of negatively correlated events in dHb terminals at the IPN and raphe. n = 6 explants, 35 calcium events. See Video S3. (K) Lateral view of dHb terminals expressing GCaMP7a at the IPN and raphe (green arrowheads) before and during a calcium burst event. (N,O) Single frame images showing calcium signal changes. Blue (N) and green (O) boxed events in (M) are shown. Areas with increased (white) or decreased (green) signals are outlined (dotted lines). Right panels show traces in the IPN and raphe during the calcium event on left. n = 21/23 explants show similar calcium signaling domains.. Scale bars: 20 μm (B,J) or 50 μm (F). See also Figures S1–S4. |
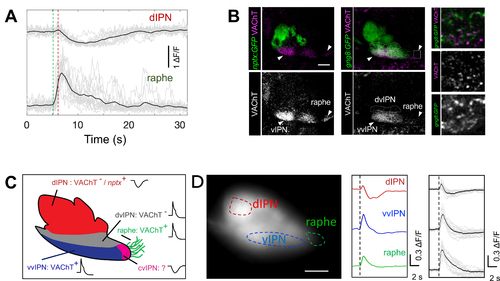
Synchronized cholinergic terminal activity at vIPN/raphe precedes non-cholinergic terminal inhibition at dIPN
(A) Average ΔF/F trace (black) of negatively correlated events (grey) in dHb terminals at the dIPN (top) and raphe (bottom). Time of increase (green) and inhibition (red) are indicated (dotted lines). Note the delay between the two events (931 ± 50 ms, n= 5 explants, 62 events). (B) Sagittal sections of anti-GFP (green) and anti-VAChT (magenta) labeling in 6 dpf Tg(nptx2:Gal4-VP16)rw0143a;Tg(UAS:GFP)c426 (left) and Tg(gng8:GAL4ff)c426;Tg(UAS:GFP)c426 (middle) larvae. White arrowheads indicate VAChT labeling in vvIPN and raphe. White box (middle) corresponds to magnified panels on right. Scale bar: 20 μm. (C) Summary of dHb terminal domains. nptx:Gal4;UAS:GFP-positive dIPN domain is indicated (nptx+). The cvIPN is only identified based on calcium signals. Calcium bursts (green) and inhibition (red) are labeled with graph plots. (D) Electric shock induces negatively correlated events. Left: Lateral view of Tg(gng8:GAL4ff)c426;Tg(UAS:GCaMP7a) larva expressing GCaMP in dHb terminals. dIPN, vIPN and raphe are outlined (dotted lines). Middle: Representative ΔF/F traces upon electric shock (black dotted line). Right: Average traces (black) of calcium events (grey) after electric shock. (n = 8 larvae, 16 events). Scale bar = 20 μm. |
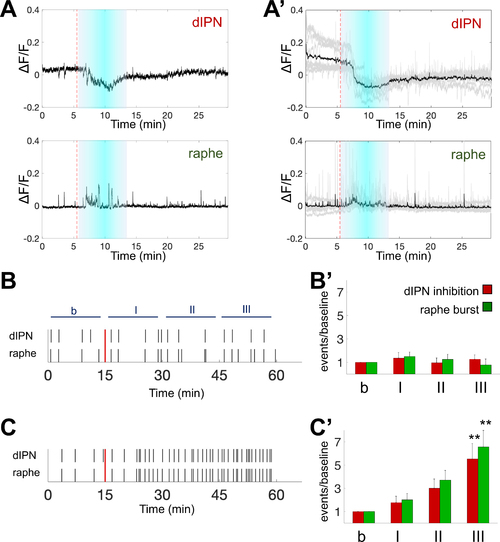
Nicotine induces prolonged negatively correlated event
(A) Representative ΔF/F traces from dHb terminals in Tg(gng8:GAL4ff)c426;Tg(UAS:GCaMP7a) explant. 5 min nicotine (10 μM) perfusion induces inhibition at the dIPN (top) and bursts at the raphe (bottom). (A’) Average ΔF/F traces (black) of nicotine-induced negatively correlated events (grey). Duration (cyan boxes) and initiation (red dotted lines) of nicotine application indicated. n = 8 explants. (B,C) Representative raster plots of dIPN inhibition and raphe burst events. (B) Control and (C) nAChR antagonist (100 μM mecamylamine and 10 μM d-tubocurarine) application. Introduction of E3 solution (B) or antagonists (C) indicated (red lines). (B’,C’) Ratio of average number of events in 15-minute windows (I, II, III) and baseline activity (b) after applying (B’) E3 (n = 4) or (C’) antagonists (n = 6). Bars indicate negatively correlated events in dHb terminals at the raphe (green, bursts) and dIPN (red, inhibition). One-way ANOVA followed by Tukey’s test, ** p<0.005. b: 15 minutes of baseline, I: 0–15, II: 15–30, III: 30–45 min after application. |
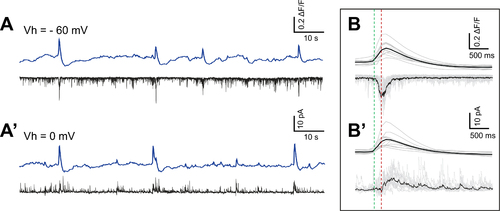
Calcium bursts correspond to acetylcholine/glutamate and GABAergic currents
(A-A’) ΔF/F traces of dHb terminals (blue) aligned with simultaneous patch-clamp recording of IPN neurons (black) show correlation of calcium bursts with increase in glutamatergic/cholinergic inward currents (A, Vh = −60 mV) and GABAergic outward currents (A’, Vh = 0 mV). (B-B’) Average traces (black) of calcium bursts (top) aligned with synaptic responses (bottom) at holding potentials of –60 mV (B, n = 4 explants, 42 events) and 0 mV (B’, n = 3 explants, 23 events). Dotted lines indicate onset for inward (green) and outward (red) currents. |
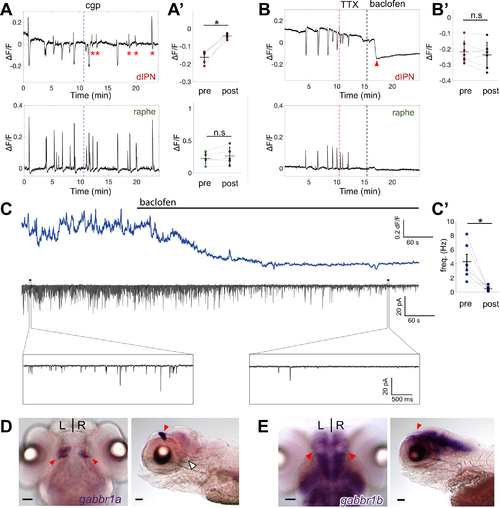
Calcium inhibition occurs via presynaptic GABAB receptors
(A-B) Representative ΔF/F traces in terminals at dIPN (top) and raphe (bottom) after application of (A) 1 μM cgp55845 or (B) 3 μM tetrodotoxin (TTX) + 2 μM baclofen. Time of drug application indicated (vertical lines). (A’) Average peak amplitude before and after cgp55845 application in terminals at the dIPN (−0.16 ± 0.03 vs −0.04 ± 0.01) and raphe (0.22 ± 0.09 vs. 0.26 ± 0.13) during inhibition (top) and burst (bottom). n = 6 explants, 50 events. Red asterisks indicate attenuated calcium inhibition at the dIPN after cgp55845 application. (B’) Paired plots comparing average inhibition amplitude in control conditions (−0.22 ± 0.07) to the average baseline decrease after baclofen application (−0.24 ± 0.08). n = 7 explants, 46 events. Note abrupt decrease (red arrowhead) in baseline at the dIPN following baclofen. (C) ΔF/F traces of IPN (top) aligned with simultaneous whole-cell patch-clamp recording trace (middle) upon baclofen perfusion. Time of baclofen application indicated (black bar). Magnified traces of synaptic activity before (left) and after (right) baclofen (bottom panels). (C’) Paired plot of synaptic activity frequency before (4.29 ± 1.05 Hz) and after (0.47 ± 0.15 Hz) baclofen. n = 6 explants. Mean ± SD indicated in (A’, B’, C’). (D,E) Dorsal (left) and sagittal (right) views of gabbr1a (D) and gabbr1b (E) expression at 6 dpf. dHb nuclei (red arrowheads) and absence of expression at IPN (white arrowhead) (D). Wilcoxon signed-rank test. * p< 0.05. Scale bars: 50 μm. |

Direct stimulation of IPN induces GABAB receptor-mediated inhibition in terminals at the dIPN
(A) Schematic of setup for simultaneous electrical stimulation and drug perfusion. (B) Representative ΔF/F traces showing attenuation of dIPN inhibition by electrical stimulation after cgp55845 perfusion (top), with bursts unaffected in the raphe (bottom). Grey boxes represent 10 min after cgp55845 application. See also Video S4. (C,D) Average traces (black) of calcium events (grey, 10 stimuli) before (c) and after (d) cgp55845. (E) Paired plot of average peak amplitudes before and after cgp55845 application during inhibition (top, −0.15 ± 0.07 vs. −0.02 ± 0.02) and burst (bottom, 0.22 ± 0.08 vs 0.2 ± 0.06). n = 6 explants, 71 events. Purple dotted lines indicate time of electrical stimulation (B-D). Purple line in (B) denotes duration of cgp55845 application. Wilcoxon signed-rank test, * p< 0.05, n.s. not significant. Mean ± SD indicated. (F) Transverse section of Tg(gng8:GAL4ff)c426;Tg(UAS:GFP)c426;Tg(gad1b:|R|-GFP) larval IPN surrounded by dHb terminals (green) and GABAergic neurons (magenta). Hoechst nuclear staining (blue). White asterisks indicate gad1b:RFP+ neurons in vIPN. White dotted line separates dIPN and vIPN (right panel). (G) Model illustrating the mechanism underlying negatively correlated events in dHb terminals at the IPN (see discussion). |