
|
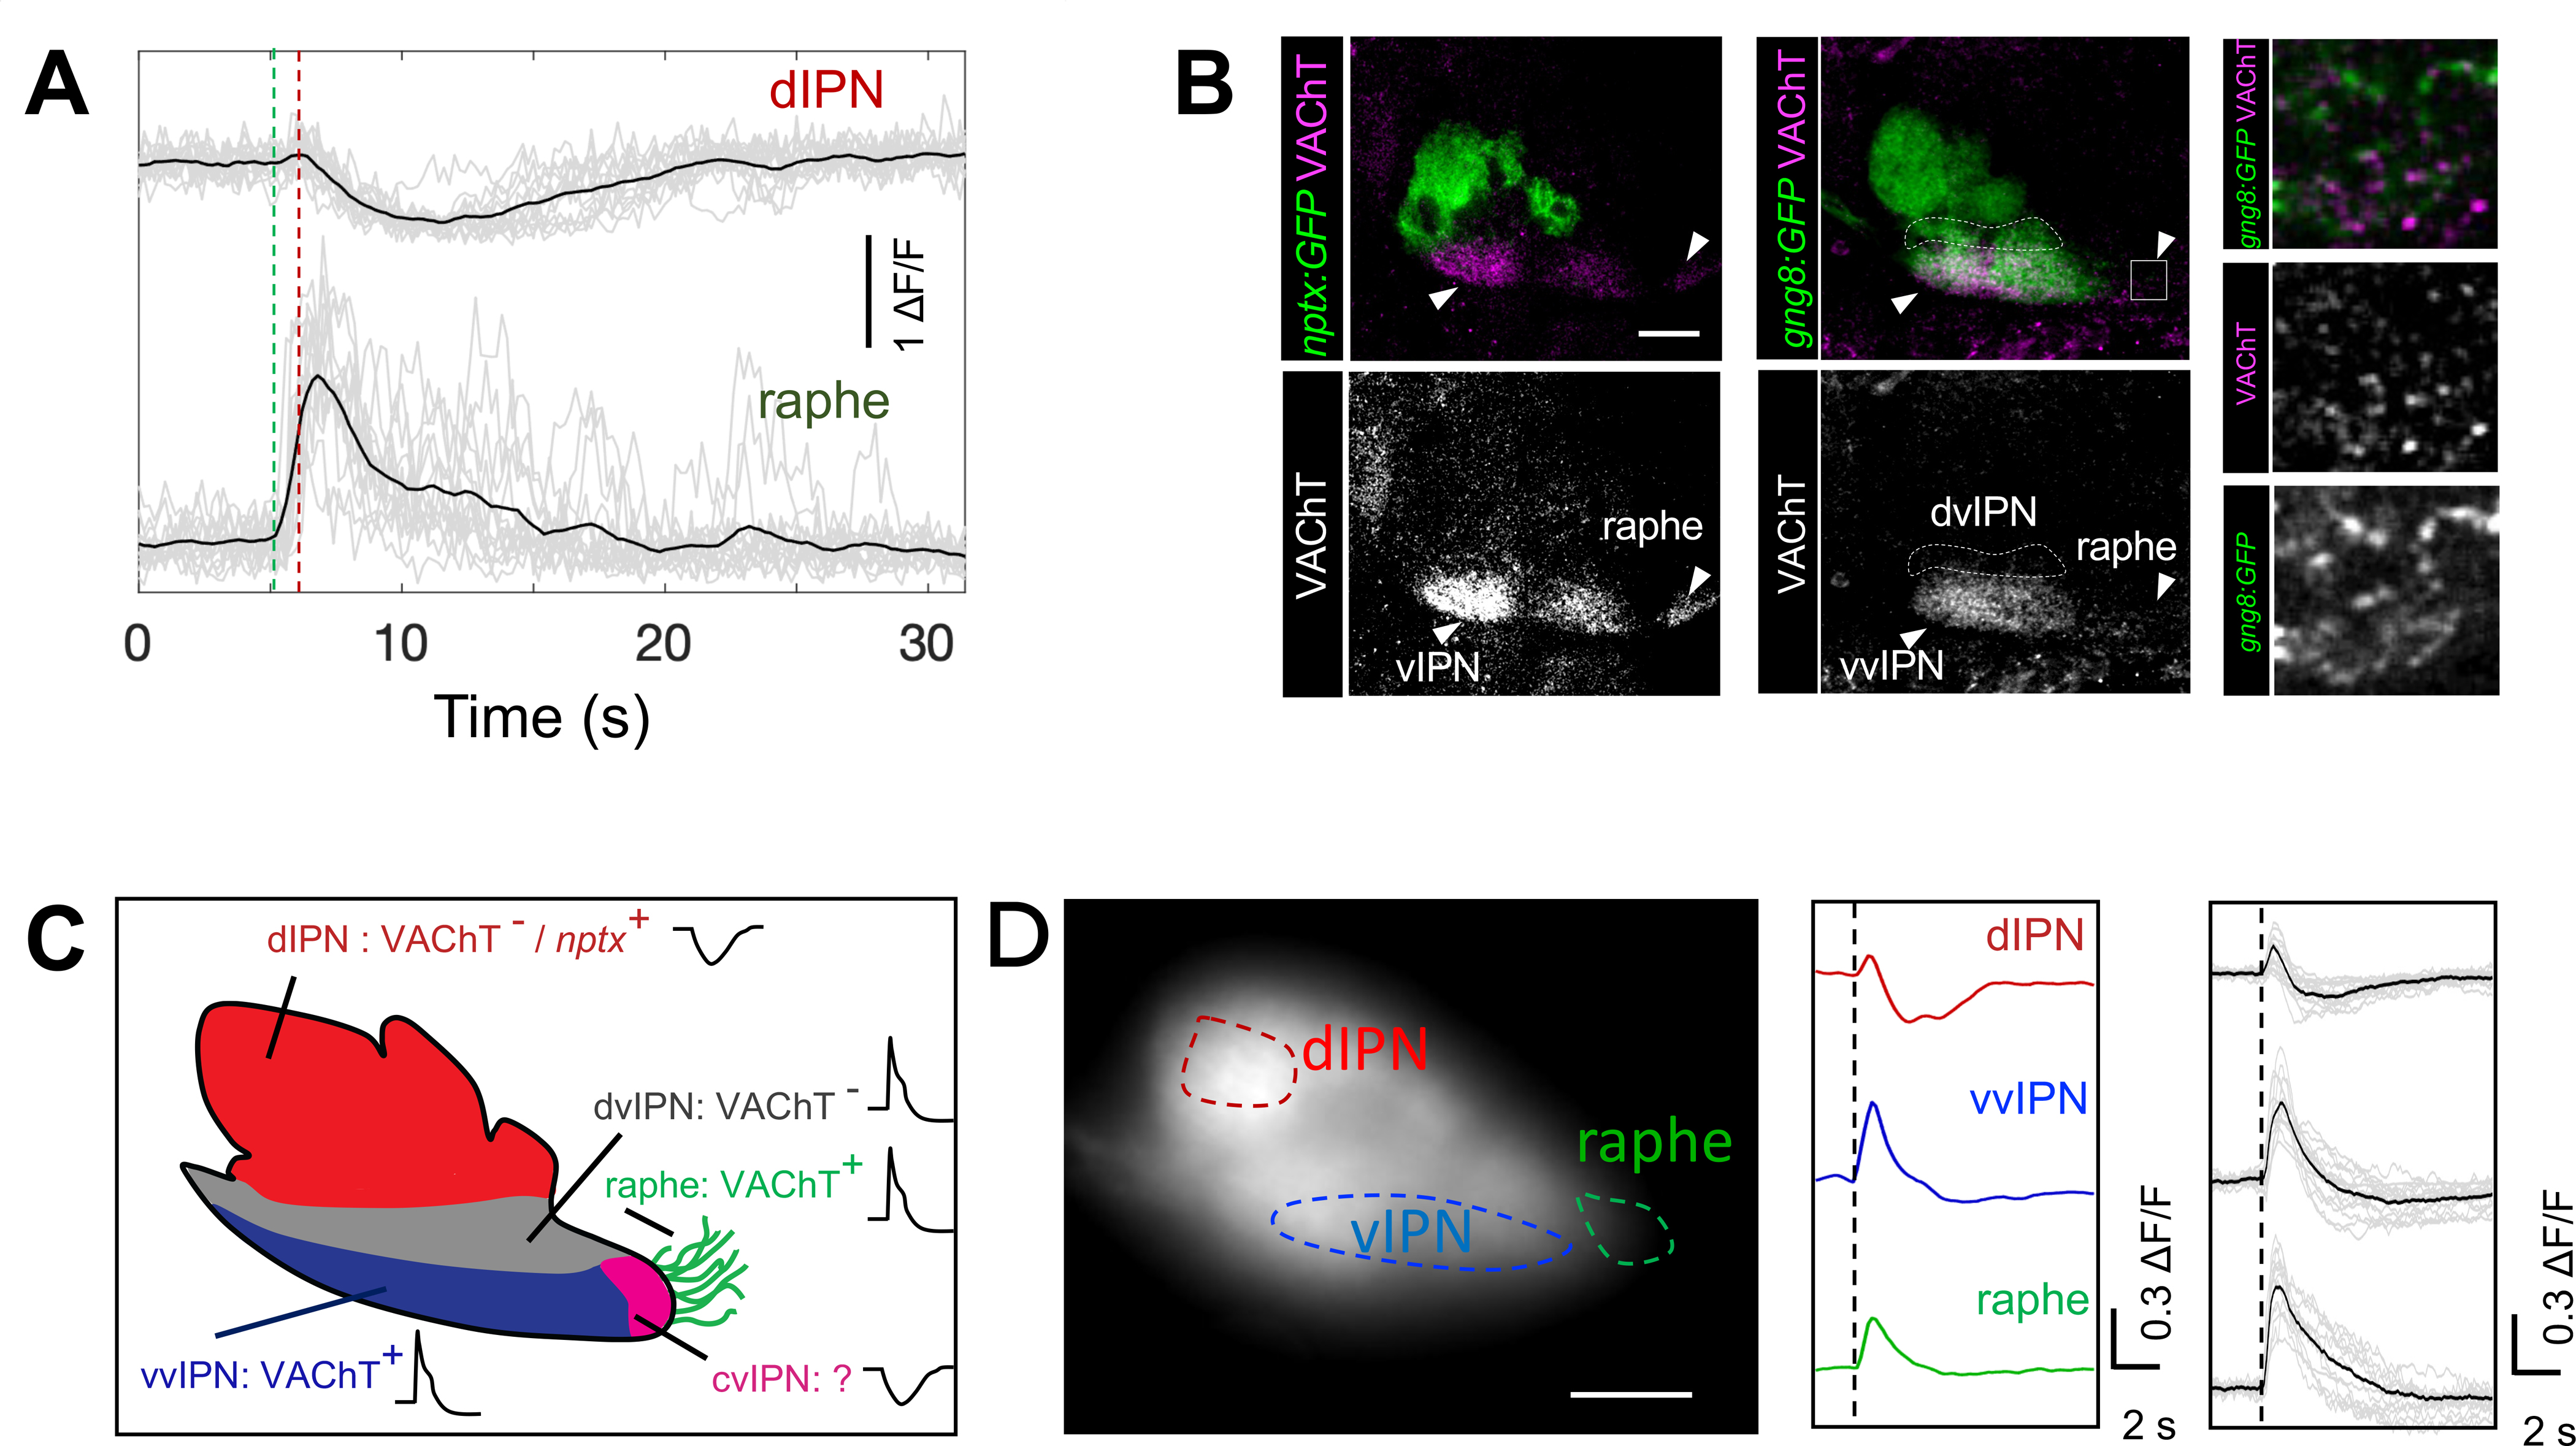
Fig. 2
(A) Average ΔF/F trace (black) of negatively correlated events (grey) in dHb terminals at the dIPN (top) and raphe (bottom). Time of increase (green) and inhibition (red) are indicated (dotted lines). Note the delay between the two events (931 ± 50 ms, n= 5 explants, 62 events).
(B) Sagittal sections of anti-GFP (green) and anti-VAChT (magenta) labeling in 6 dpf Tg(nptx2:Gal4-VP16)rw0143a;Tg(UAS:GFP)c426 (left) and Tg(gng8:GAL4ff)c426;Tg(UAS:GFP)c426 (middle) larvae. White arrowheads indicate VAChT labeling in vvIPN and raphe. White box (middle) corresponds to magnified panels on right. Scale bar: 20 μm.
(C) Summary of dHb terminal domains. nptx:Gal4;UAS:GFP-positive dIPN domain is indicated (nptx+). The cvIPN is only identified based on calcium signals. Calcium bursts (green) and inhibition (red) are labeled with graph plots.
(D) Electric shock induces negatively correlated events. Left: Lateral view of Tg(gng8:GAL4ff)c426;Tg(UAS:GCaMP7a) larva expressing GCaMP in dHb terminals. dIPN, vIPN and raphe are outlined (dotted lines). Middle: Representative ΔF/F traces upon electric shock (black dotted line). Right: Average traces (black) of calcium events (grey) after electric shock. (n = 8 larvae, 16 events). Scale bar = 20 μm.