
Fig. 1
- ID
- ZDB-FIG-221214-12
- Publication
- Zaupa et al., 2021 - Trans-inhibition of axon terminals underlies competition in the habenulo-interpeduncular pathway
- Other Figures
- All Figure Page
- Back to All Figure Page
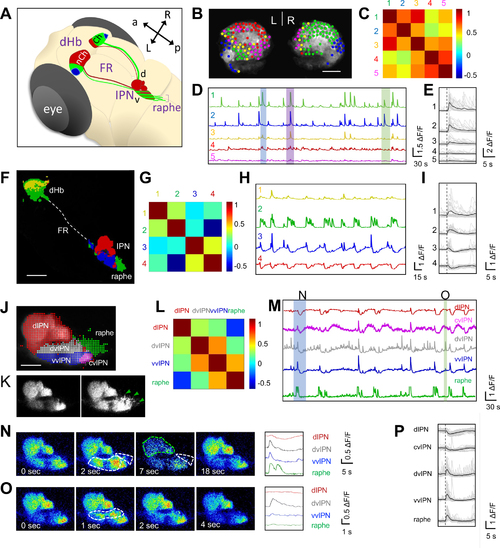
Identification of functional domains in dHb-IPN pathway during spontaneous activity
(A) Schematic of dHb-IPN pathway of larval zebrafish. Non-cholinergic (nCh, red) neurons are mainly in the left dHb and project to the dorsal IPN (d) whereas cholinergic (Ch, green) neurons are largely in the right dHb and project to the ventral IPN (v) and raphe (bracket). Somatostatinergic neurons are depicted in blue. Anterior (a), posterior (p), left (L) and right (R). (B, F, J) Representative 6 day post fertilization (dpf) Tg(gng8:GAL4ff)c426;Tg(UAS:GCaMP7a) brain explants expressing GCaMP in dHb neurons (B), left dHb and their terminals (F) and terminals at the IPN and raphe (J), overlaid by colored circles representing functional domains identified by k-means clustering. Dotted line depicts the fasciculus retroflexus (FR) in (F). (C, G, L) Correlation matrix of average ΔF/F signals between different clusters of dHb soma (C), dHb soma and terminals (G) and terminals at the IPN and raphe (L). (D, H, M) Average ΔF/F traces from each cluster in 10-minute recordings. Colored boxed events in (D) correspond to single frame images in Figure S1. (E, I, P) Average ΔF/F traces (black) of individual calcium events (grey). (E) Traces of green/blue neurons exhibiting synchronized activity. n = 6 explants, 29 events. See Video S1. (I) Traces of calcium bursts in the ventral dHb and dHb terminals at the vIPN and raphe (green, blue). Note that dHb terminals at the dIPN exhibit inhibition (trace 4). n = 5 explants, 24 events. See Video S2. (P) Traces of negatively correlated events in dHb terminals at the IPN and raphe. n = 6 explants, 35 calcium events. See Video S3. (K) Lateral view of dHb terminals expressing GCaMP7a at the IPN and raphe (green arrowheads) before and during a calcium burst event. (N,O) Single frame images showing calcium signal changes. Blue (N) and green (O) boxed events in (M) are shown. Areas with increased (white) or decreased (green) signals are outlined (dotted lines). Right panels show traces in the IPN and raphe during the calcium event on left. n = 21/23 explants show similar calcium signaling domains.. Scale bars: 20 μm (B,J) or 50 μm (F). See also Figures S1–S4. |