
|
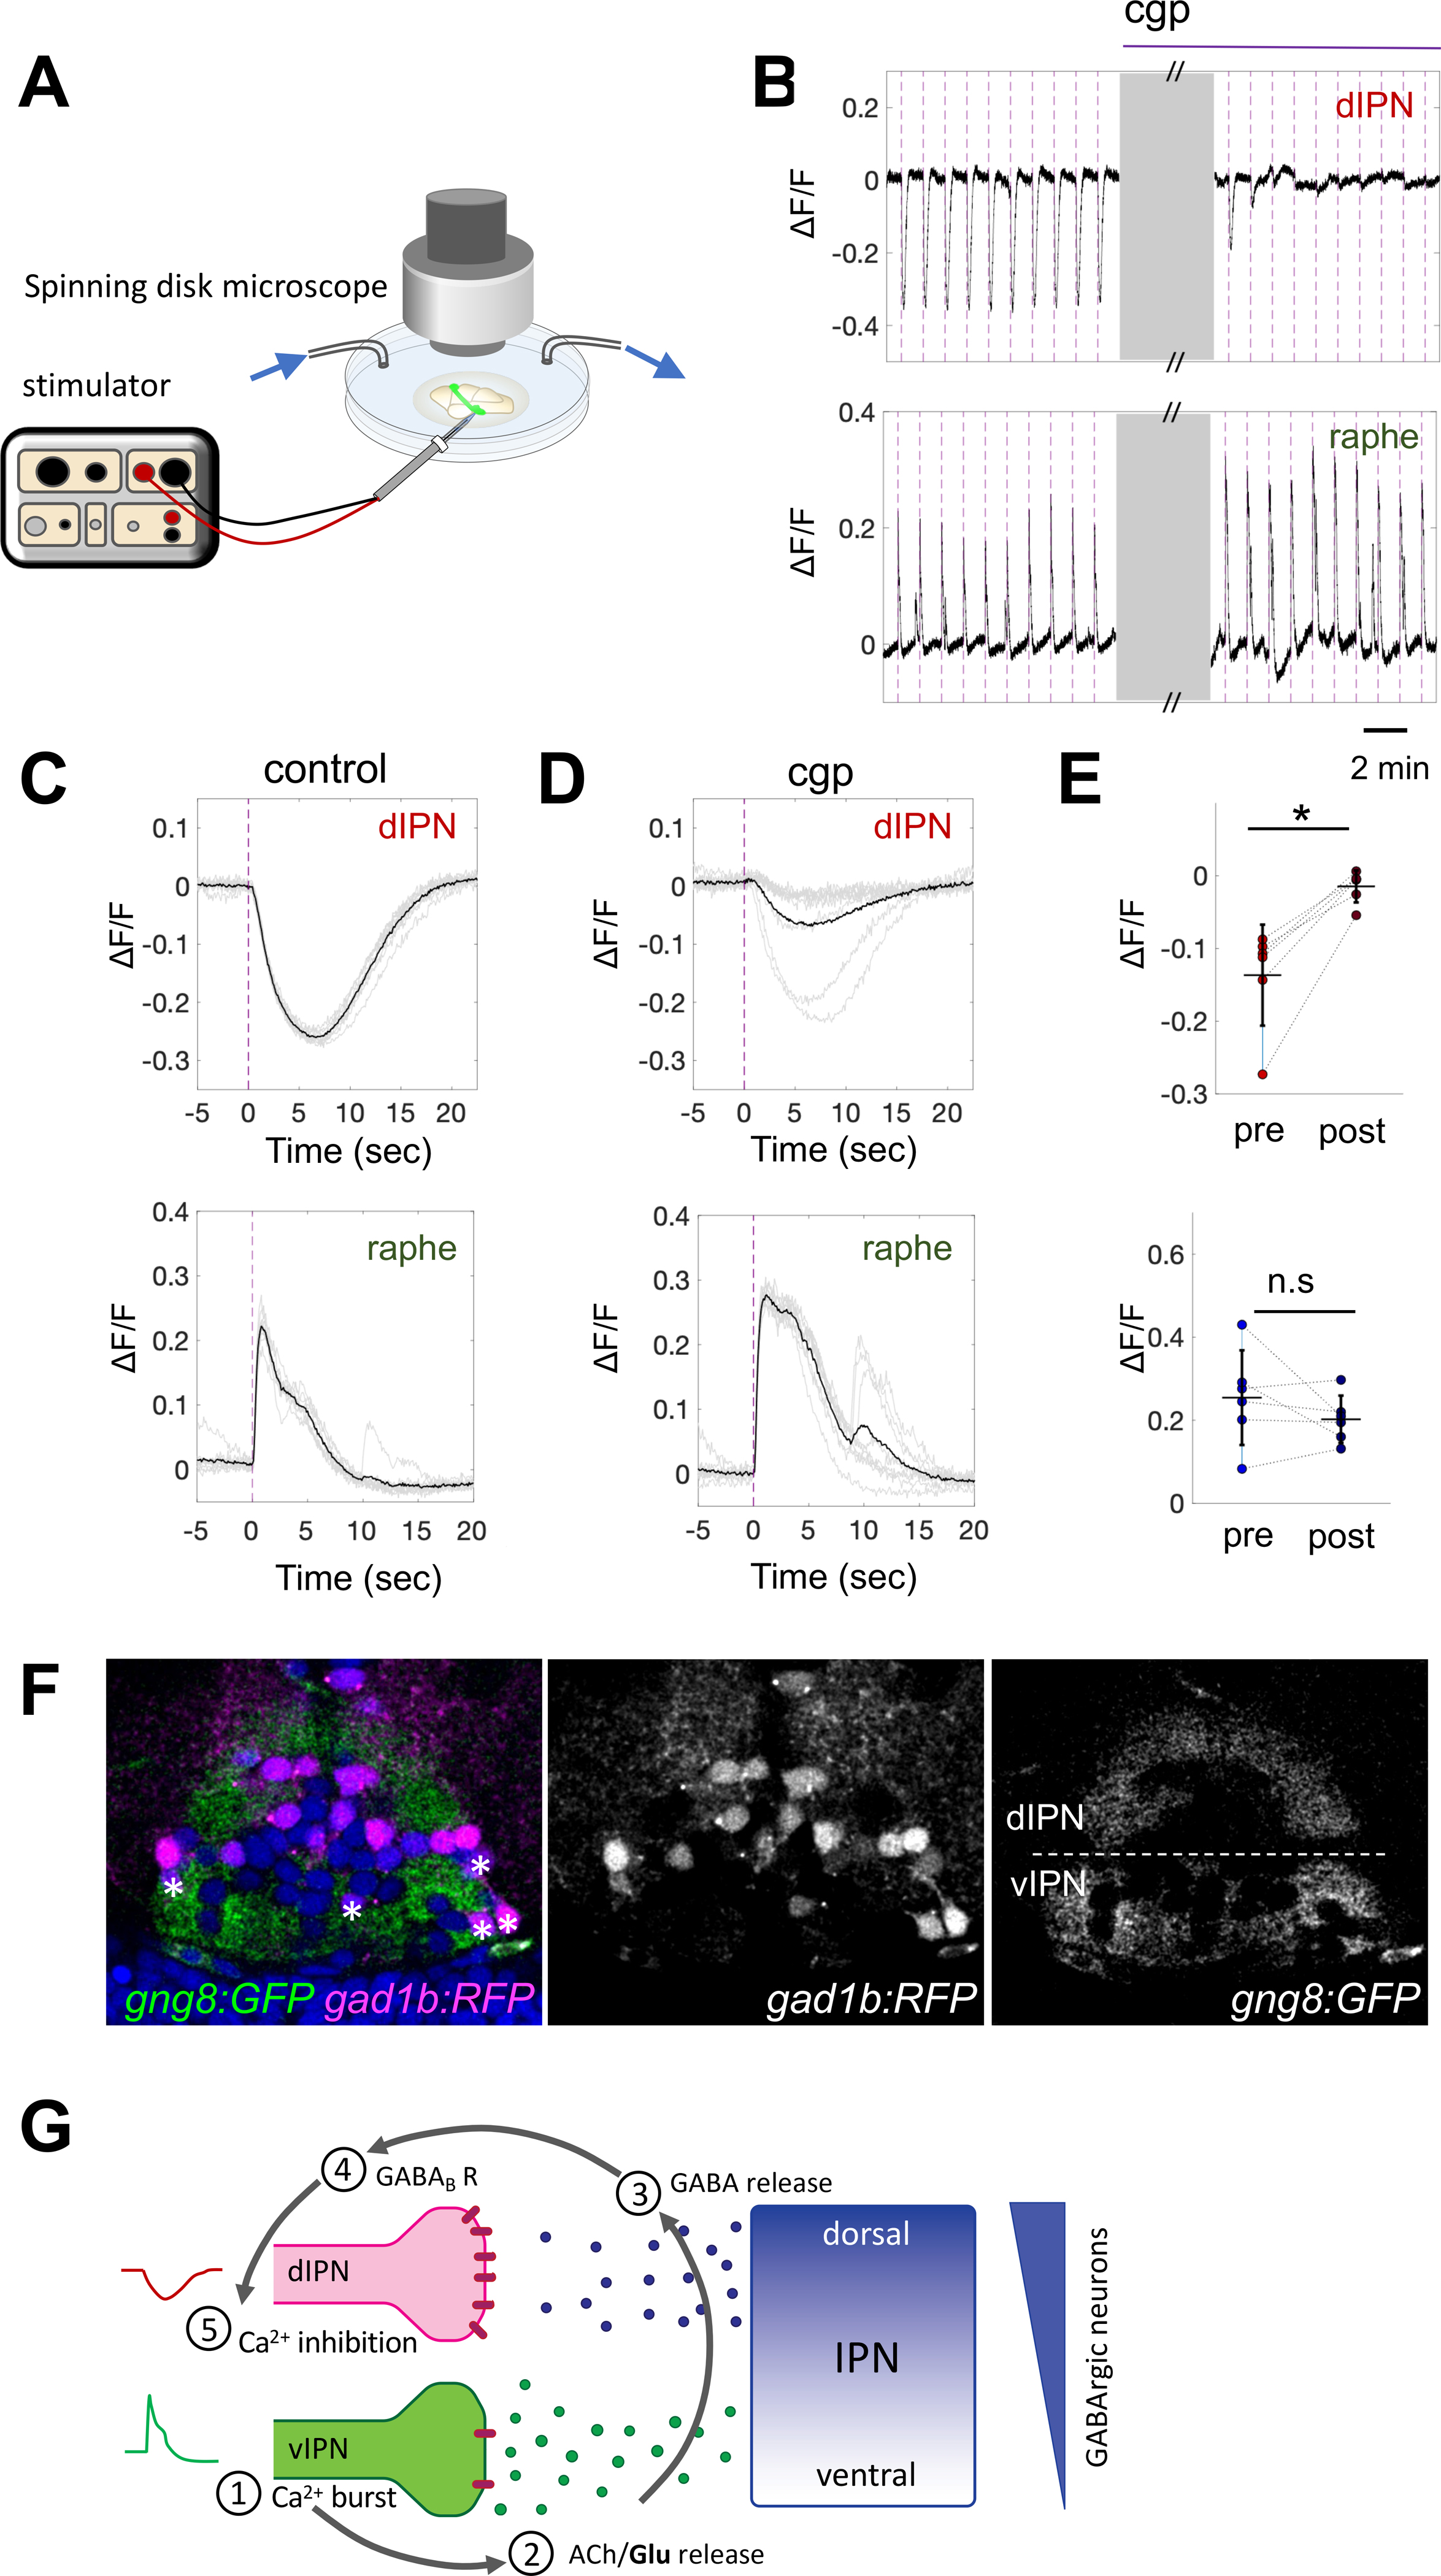
Fig. 6
(A) Schematic of setup for simultaneous electrical stimulation and drug perfusion.
(B) Representative ΔF/F traces showing attenuation of dIPN inhibition by electrical stimulation after cgp55845 perfusion (top), with bursts unaffected in the raphe (bottom). Grey boxes represent 10 min after cgp55845 application. See also Video S4.
(C,D) Average traces (black) of calcium events (grey, 10 stimuli) before (c) and after (d) cgp55845.
(E) Paired plot of average peak amplitudes before and after cgp55845 application during inhibition (top, −0.15 ± 0.07 vs. −0.02 ± 0.02) and burst (bottom, 0.22 ± 0.08 vs 0.2 ± 0.06). n = 6 explants, 71 events. Purple dotted lines indicate time of electrical stimulation (B-D). Purple line in (B) denotes duration of cgp55845 application. Wilcoxon signed-rank test, * p< 0.05, n.s. not significant. Mean ± SD indicated.
(F) Transverse section of Tg(gng8:GAL4ff)c426;Tg(UAS:GFP)c426;Tg(gad1b:|R|-GFP) larval IPN surrounded by dHb terminals (green) and GABAergic neurons (magenta). Hoechst nuclear staining (blue). White asterisks indicate gad1b:RFP+ neurons in vIPN. White dotted line separates dIPN and vIPN (right panel).
(G) Model illustrating the mechanism underlying negatively correlated events in dHb terminals at the IPN (see discussion).