
- Title
-
FDA-Approved Drug Screening for Compounds That Facilitate Hematopoietic Stem and Progenitor Cells (HSPCs) Expansion in Zebrafish
- Authors
- Feng, Z., Lin, C., Tu, L., Su, M., Song, C., Liu, S., Suryanto, M.E., Hsiao, C.D., Li, L.
- Source
- Full text @ Cells
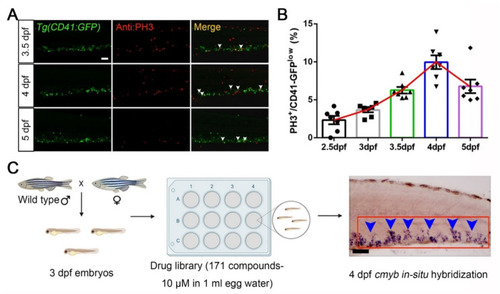
FDA-approved drug screening on compounds boosting HSPCs expansion in zebrafish. (A) The immunofluorescent staining images of Tg(CD41-GFP) and Phospho-Histone H3 (PH3). White arrowheads indicate merged signals. (B) Statistical diagram of corresponding percentage of PH3+ cells in CD41-GFP low populations (2.5 dpf, 2.33 ± 0.55; 3 dpf, 3.66 ± 0.31; 3.5 dpf, 6.26 ± 0.43; 4 dpf, 9.96 ± 0.90; 6.78 ± 0.90). (C) An overview of the experimental design in this study for drug screening by using zebrafish. A total of 20 wild-type embryos (3 dpf) were transferred to each well in a 12-well plate format. Then, embryos were administrated with one of 171 FDA-approved drugs for 24 h and screened for quantitative increases or decreases of signals in the CHT (caudal hematopoietic tissue) region at 4 dpf. The red box indicates the CHT region, and blue arrowheads indicate cmyb+ signals. Mean ± SEM, n = 7; Scale bar, 50 μm. |
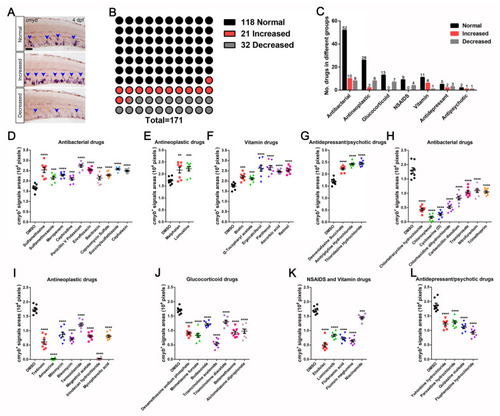
Preliminary FDA-approved drug screening results for cmyb+ HSPCs in zebrafish embryos. (A) Examples of screening and phenotyping between cmyb in situ hybridization phenotypes in comparison with the normal control zebrafish. (B) Statistical summary of drugs available, including normal signals (118 compounds), increased signals (21 compounds), and decreased signals (32 compounds). (C) Statistical diagram of drugs represented by each category. (D–G) The drug treatments augment cmyb+ signals. (D) Antibacterial drugs (Pixels; DMSO, 16,680 ± 608; Sulfamethazine, 25,360 ± 1281; Sulfamethoxazole, 21,540 ± 699; Meropenem, 22,790 ± 443; Cephradine, 20,940 ± 616; Penicillin V Potassium, 27,290 ± 647; Enrofloxacin, 25,450 ± 355; Bacitracin, 21,350 ± 841; Capreomycin Sulfate, 22,860 ± 454; Succinylsulfathiazole, 25,800 ± 341; Cephalexin, 24,890 ± 348). (E) Antineoplastic drugs (Pixels; DMSO, 17,230 ± 509; Melphalan, 21,650 ± 1205; Lomustine, 22,230 ± 963). (F) Vitamin drugs (Pixels, DMSO, 17,530 ± 552; Biotin, 22,050 ± 651; α-Tochopheryl acetate, 21,130 ± 528; Ergocalciferol, 26,190 ± 1457; Panthenol, 26,490 ± 1084; Ascorbic acid, 24,610 ± 345; Retinol, 25,380 ± 622). (G) Antidepressant/psychotic drugs (Pixels; DMSO, 16,910 ± 483; Desvenlafaxine Succinate, 22,210 ± 437; Amitriptyline hydrochloride, 24,230 ± 362; Thioridazine hydrochloride, 24,450 ± 421). (H–L) The drug treatment diminishes cmyb+ signals. (H) Antibacterial drugs (Pixels; DMSO, 17,940 ± 985; Chlortetracycline hydrochloride, 4400 ± 3402; Chloroxylenol, 1625 ± 380; Cycloserine (D), 2600 ± 369; Chlorhexidine dihydrochloride, 5163 ± 479; Carbenicillin disodium, 8325 ± 638; Tramiprosate, 10,450 ± 543; Nitrofurantoin, 10,900 ± 614; Trimethoprim, 10,480 ± 376). (I) Antineoplastic drugs (Pixels; DMSO, 17,410 ± 505; Tretinoin, 6088 ± 783; Amsacrine, 238 ± 107; Mitomycin, 8625 ± 802; Bleomycin, 7125 ± 394; Temozolamide, 12,130 ± 531; Megestrol acetate, 8075 ± 420; Irinotecan hydrochloride, 263 ± 145; Mycophenolic acid, 8063 ± 431). (J) Glucocorticoid drugs (Pixels; DMSO, 17,000 ± 398; Dexamethasone sodium phosphate, 9075 ± 433; Mometasone furoate, 8325 ± 676; Budesonide, 12,140 ± 332; Triamcinolone acetonide, 5463 ± 512; Triamcinolone diacetate, 13,040 ± 532; Betamethasone, 9288 ± 539; Alclometazone dipropionate, 9738 ± 767). (K) NSAIDS and Vitamin drugs (Pixels; DMSO, 17,080 ± 440; Etodolac, 5025 ± 663; Lumiracoxib, 8350 ± 385; Flufenamic acid, 7250 ± 436; Flunixin meglumine, 6400 ± 400; Niacinamide, 14,450 ± 383). (L) Antidepressant/psychotic drugs (Pixels; DMSO, 18,710 ± 729; Yohimbine hydrochloride, 12,240 ± 535; Paroxetine hydrochloride, 12,830 ± 546; Quipazine maleate, 11,100 ± 502; Fluphenazine hydrochloride, 9238 ± 509). Scale bar, 50 μm; Mean ± SEM, n = 8; ** p< 0.01, *** p < 0.001, **** p < 0.0001. |
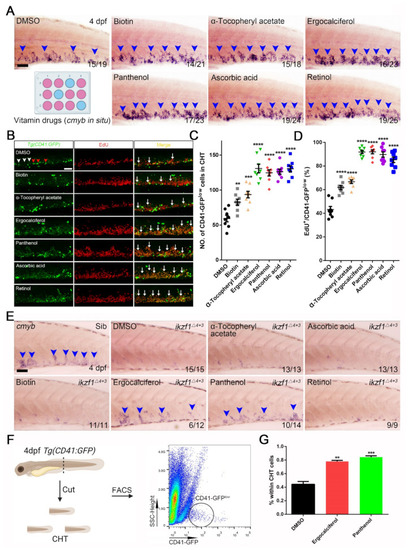
Vitamin drugs boost HSPCs expansion in zebrafish embryos and mitigate HSPCs expansion defective phenotype in ikzf1−/− mutants. (A) Whole mount in situ hybridization (WISH) of cmyb after treating with vitamin drugs, including biotin, α-tocopheryl acetate, ergocalciferol, panthenol, ascorbic acid and retinol. Blue arrowheads indicate the cmyb+ signals. (B) Double staining images of Tg(CD41:GFP) with EdU after treating with these vitamin drugs. White arrowheads indicate CD41-GFP low cells while red arrowheads indicate CD41-GFP high cells. The white arrows indicate the double labelled cells (EdU/CD41-GFP low). (C) Quantification the number of CD41-GFP low cells. DMSO, 59 ± 5; Biotin, 83 ± 4; α-Tocopheryl acetate, 94 ± 5; Ergocalciferol, 131 ± 6; Panthenol, 125 ± 4; Ascorbic acid, 126 ± 4; Retinol, 130 ± 4). (D) Statistical result of EdU incorporation assay in Tg(CD41:GFP) (DMSO, 43.25 ± 2.54; Biotin, 61.75 ± 1.80; α-Tocopheryl acetate, 66.75 ± 1.56; Ergocalciferol, 91.88 ± 1.37; Panthenol, 92.00 ± 1.66; Ascorbic acid, 89.75 ± 2.22; Retinol, 85.25 ± 2.29). (E) WISH of cmyb after treating with α-Tocopheryl acetate, Ascorbic acid, Biotin, Ergocalciferol, Panthenol and Retinol. The blue arrowheads indicate cmyb+ signals in CHT region. (F) Schematic diagram of FACS analysis. The black circle indicates CD41-GFPlow population. (G) Quantification results of CD41-GFPlow cells within the whole CHT cells after ergocalciferol and panthenol treatment (Mean ± SEM, n = 3; DMSO, 0.44 ± 0.041; Ergocalciferol, 0.78 ± 0.015; Panthenol, 0.84 ± 0.019). Scale bar, 50 μm; ** p < 0.01, *** p < 0.001, **** p < 0.0001. |
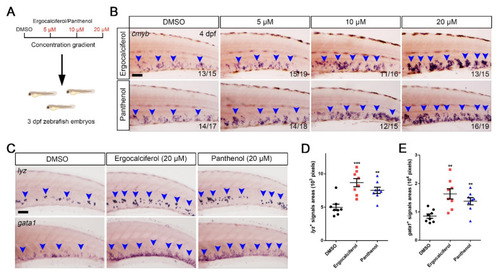
Ergocalciferol and panthenol facilitate HSPCs expansion in a dosage-dependent manner. (A) Schematic diagram of concentration gradient using ergocalciferol and panthenol. (B) WISH of cmyb with different concentration (5, 10, 20 μM). Blue arrowheads indicate cmyb+ signals. (C) WISH of lyz (upper) and gata1 (bottom) after treating with ergocalciferol and panthenol using 20 μM. (D,E) Quantification of lyz+ (left) and gata1+ (right) signals areas in the CHT region. (Pixels, lyz+ signals; DMSO, 4980 ± 467; Ergocalciferol, 8678 ± 617; Panthenol, 7524 ± 468; gata1+ signals; DMSO, 8525 ± 768; Ergocalciferol, 16,350 ± 1816; Panthenol, 13,790 ± 1252). Scale bar, 50 μm; Mean ± SEM, n = 8; ** p < 0.01, *** p <0.001. |
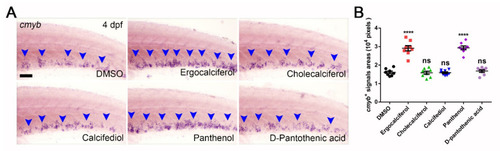
Comparison of the analog effects of ergocalciferol and panthenol. (A) WISH of cmyb after treating with ergocalciferol and its analogs (cholecalciferol and calcifediol) as well as panthenol and its analog (D-pantothenic acid). Blue arrowheads indicate cmyb+ signals. (B) Statistical data of (A) (Pixels; DMSO, 16,090 ± 659; Ergocalciferol, 29,110 ± 1399; Cholecalciferol, 15,840 ± 821; Calcifediol, 15,880 ± 485; Panthenol, 29,340 ± 1014; D-pantothenic acid, 16,790 ± 689). Scale bar, 50 μm; Mean ± SEM, n = 8; ns, no significance; **** p < 0.0001. |