
|
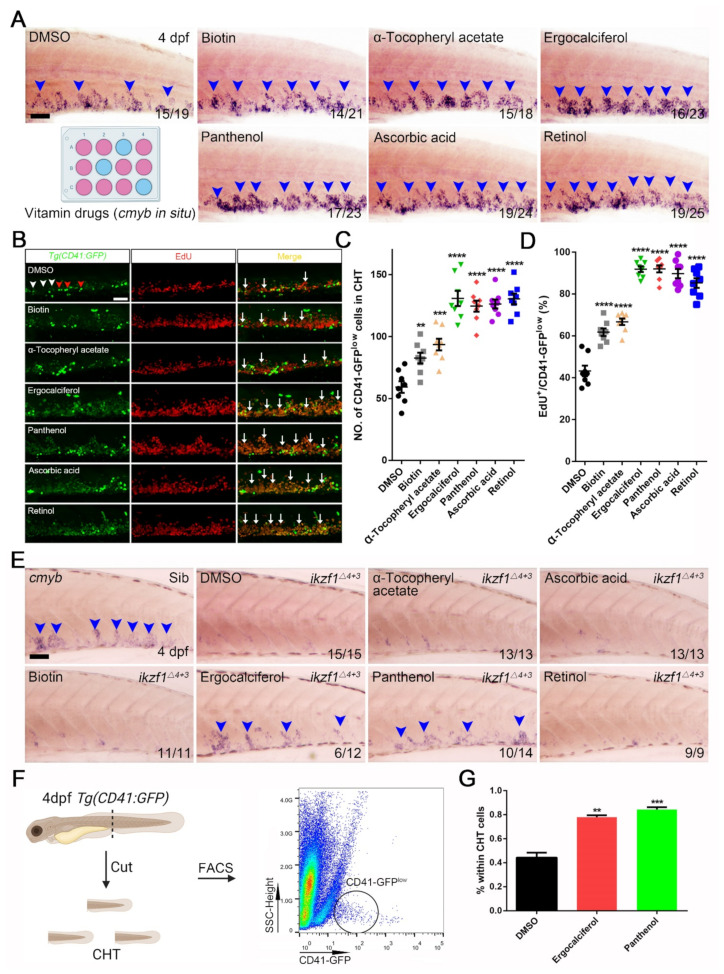
Figure 3
Vitamin drugs boost HSPCs expansion in zebrafish embryos and mitigate HSPCs expansion defective phenotype in ikzf1−/− mutants. (A) Whole mount in situ hybridization (WISH) of cmyb after treating with vitamin drugs, including biotin, α-tocopheryl acetate, ergocalciferol, panthenol, ascorbic acid and retinol. Blue arrowheads indicate the cmyb+ signals. (B) Double staining images of Tg(CD41:GFP) with EdU after treating with these vitamin drugs. White arrowheads indicate CD41-GFP low cells while red arrowheads indicate CD41-GFP high cells. The white arrows indicate the double labelled cells (EdU/CD41-GFP low). (C) Quantification the number of CD41-GFP low cells. DMSO, 59 ± 5; Biotin, 83 ± 4; α-Tocopheryl acetate, 94 ± 5; Ergocalciferol, 131 ± 6; Panthenol, 125 ± 4; Ascorbic acid, 126 ± 4; Retinol, 130 ± 4). (D) Statistical result of EdU incorporation assay in Tg(CD41:GFP) (DMSO, 43.25 ± 2.54; Biotin, 61.75 ± 1.80; α-Tocopheryl acetate, 66.75 ± 1.56; Ergocalciferol, 91.88 ± 1.37; Panthenol, 92.00 ± 1.66; Ascorbic acid, 89.75 ± 2.22; Retinol, 85.25 ± 2.29). (E) WISH of cmyb after treating with α-Tocopheryl acetate, Ascorbic acid, Biotin, Ergocalciferol, Panthenol and Retinol. The blue arrowheads indicate cmyb+ signals in CHT region. (F) Schematic diagram of FACS analysis. The black circle indicates CD41-GFPlow population. (G) Quantification results of CD41-GFPlow cells within the whole CHT cells after ergocalciferol and panthenol treatment (Mean ± SEM, n = 3; DMSO, 0.44 ± 0.041; Ergocalciferol, 0.78 ± 0.015; Panthenol, 0.84 ± 0.019). Scale bar, 50 μm; ** p < 0.01, *** p < 0.001, **** p < 0.0001.