
Figure 4
- ID
- ZDB-FIG-210902-111
- Publication
- Feng et al., 2021 - FDA-Approved Drug Screening for Compounds That Facilitate Hematopoietic Stem and Progenitor Cells (HSPCs) Expansion in Zebrafish
- Other Figures
- All Figure Page
- Back to All Figure Page
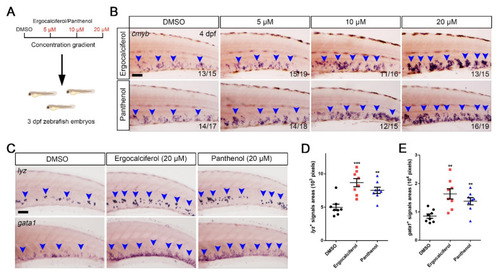
Ergocalciferol and panthenol facilitate HSPCs expansion in a dosage-dependent manner. (A) Schematic diagram of concentration gradient using ergocalciferol and panthenol. (B) WISH of cmyb with different concentration (5, 10, 20 μM). Blue arrowheads indicate cmyb+ signals. (C) WISH of lyz (upper) and gata1 (bottom) after treating with ergocalciferol and panthenol using 20 μM. (D,E) Quantification of lyz+ (left) and gata1+ (right) signals areas in the CHT region. (Pixels, lyz+ signals; DMSO, 4980 ± 467; Ergocalciferol, 8678 ± 617; Panthenol, 7524 ± 468; gata1+ signals; DMSO, 8525 ± 768; Ergocalciferol, 16,350 ± 1816; Panthenol, 13,790 ± 1252). Scale bar, 50 μm; Mean ± SEM, n = 8; ** p < 0.01, *** p <0.001. |