
|
Figure 1
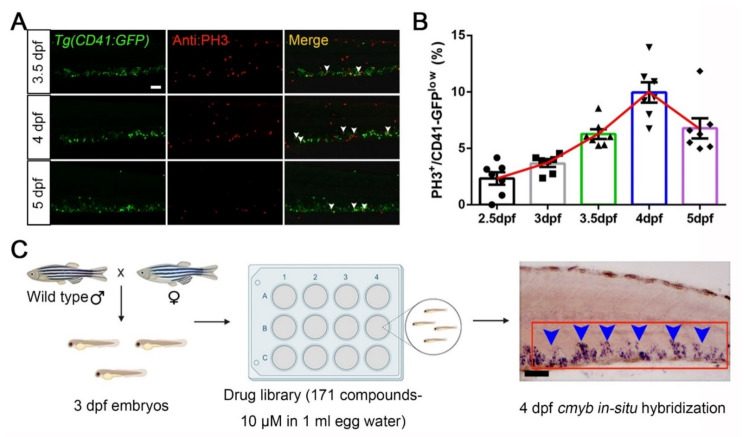
FDA-approved drug screening on compounds boosting HSPCs expansion in zebrafish. (A) The immunofluorescent staining images of Tg(CD41-GFP) and Phospho-Histone H3 (PH3). White arrowheads indicate merged signals. (B) Statistical diagram of corresponding percentage of PH3+ cells in CD41-GFP low populations (2.5 dpf, 2.33 ± 0.55; 3 dpf, 3.66 ± 0.31; 3.5 dpf, 6.26 ± 0.43; 4 dpf, 9.96 ± 0.90; 6.78 ± 0.90). (C) An overview of the experimental design in this study for drug screening by using zebrafish. A total of 20 wild-type embryos (3 dpf) were transferred to each well in a 12-well plate format. Then, embryos were administrated with one of 171 FDA-approved drugs for 24 h and screened for quantitative increases or decreases of signals in the CHT (caudal hematopoietic tissue) region at 4 dpf. The red box indicates the CHT region, and blue arrowheads indicate cmyb+ signals. Mean ± SEM, n = 7; Scale bar, 50 μm.